Viewing your driving score
Who can do it: Customer driver
Where: Wialon Driver mobile app
The Driving score feature in Wialon Driver lets you view your overall driving performance, track how your score changes over time, identify areas for improvement, and review individual violations. Your score is calculated based on the driver behavior criteria configured by the service provider.
Viewing your driving score
To access your driving score:
-
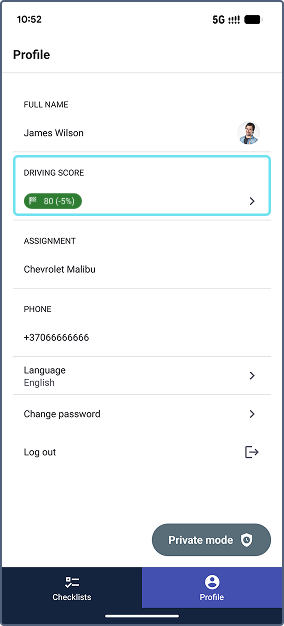
In Wialon Driver, open the Profile page.
-
In the Driving score section, you can see your score for the current month and the score change compared to the previous month (in percent).
The score is color-coded based on your performance:
| Score range | Color | Description |
|---|---|---|
| 0–49 | Red | Risky driving |
| 50–89 | Orange | Mostly safe driving |
| 90–100 | Green | Excellent driving |
To open the dedicated Driving score page with detailed information, tap the Driving score section.
Analyzing driving score details
The Driving score screen provides a detailed view of your driving performance for a selected period.
By default, the Driving score page displays data for the current month. To analyze a different period:
-
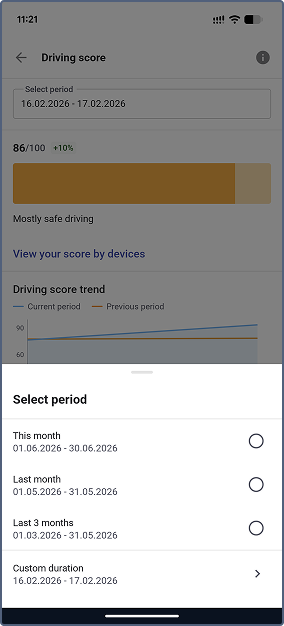
Tap the Select period field at the top of the page.
-
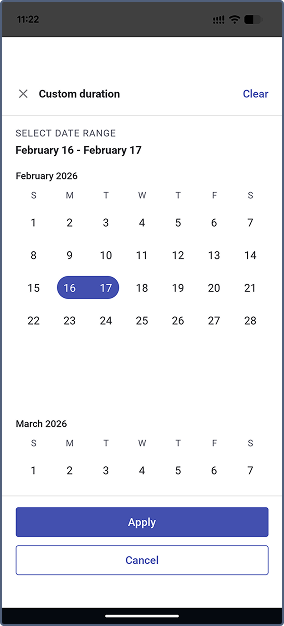
Select a preset period: this month, last month or last 3 months. To select a custom period, tap Custom duration. In the calendar, select the start and end dates for the period you want to analyze. To select a specific day, tap this day two times.
-
Tap Apply to update the page with data for the selected period.
You can tap Clear to reset the selection or Cancel to close the calendar without changes.
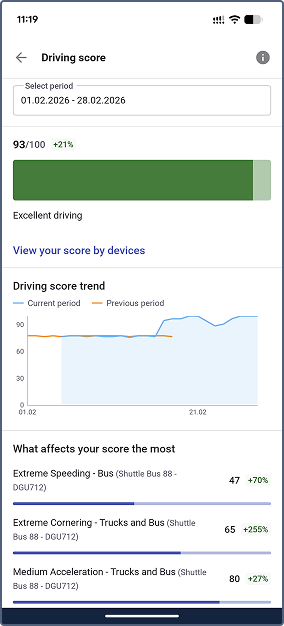
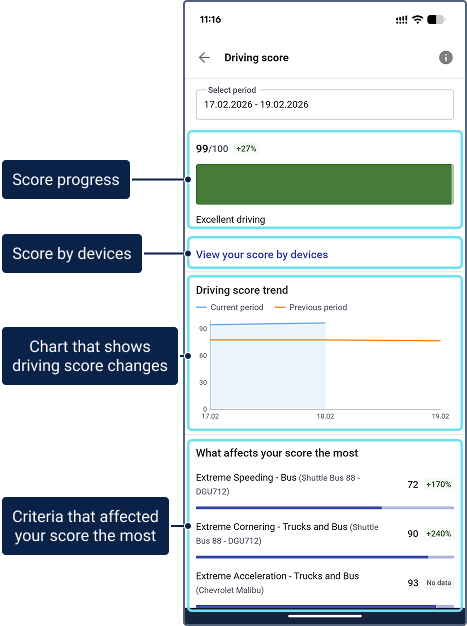
The Driving score screen includes the following information:
- Score progress: Your current score displayed with color coding and a comparison to the previous period.
- Score by devices: A link to view your score broken down by device (see Viewing score by device).
- Score trend chart: A chart showing how your score changes over time with comparison to the previous period.
- What affects your score the most: A list of the top criteria that affected your score (see Viewing criteria). To open the entire list, click View all criteria.
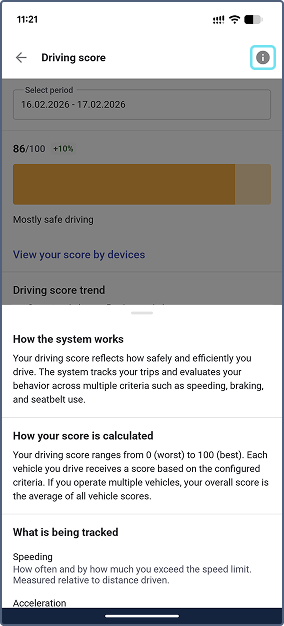
Tap the info icon
in the header of the Driving score page to open a panel that explains how your score is calculated.
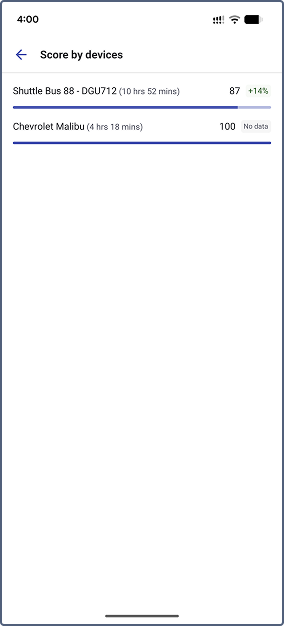
Viewing score by device
This view helps you understand which vehicles contribute the most to your overall score and identify specific areas for improvement on each vehicle.
To see how your score is distributed if you are using different vehicles:
-
On the Driving score page, tap See your score by devices. The app displays a list of vehicles with your driving score for each one.
-
Select a vehicle from the list to see the criteria and their individual scores for that vehicle.
You can switch between vehicles directly from the device details page.
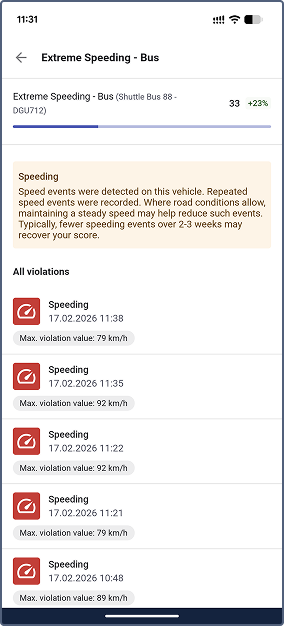
Viewing violations
To view violation details from the Score by devices screen, follow the next steps:
-
Tap View your score by devices.
-
Select the vehicle.
-
Select the criterion. For each violation in the list, you can see its date, time, and key details.
-
Tap the violation line to open its details.
Violations are sorted by date, starting with the most recent.
You can also view violations from the Viewing criteria screen.
Driving score trend
The Driving score screen includes a trend chart that shows how your score changes over the selected period. The chart also displays data from the previous period for comparison, so you can track whether your driving performance is improving.
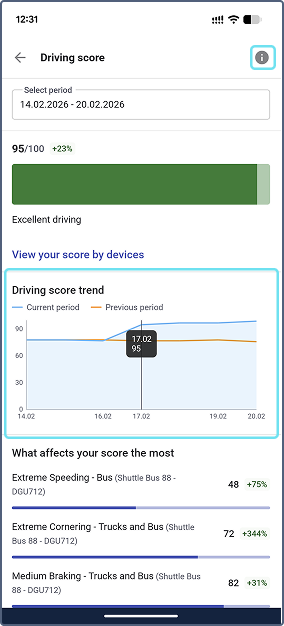
Depending on the length of the selected period, the chart groups data by day, week, or month. Tap on a data point to see the exact score value for that date.
Viewing criteria
The What affects your score the most section on the Driving score page shows the top 3 criteria that have the biggest negative impact on your score.
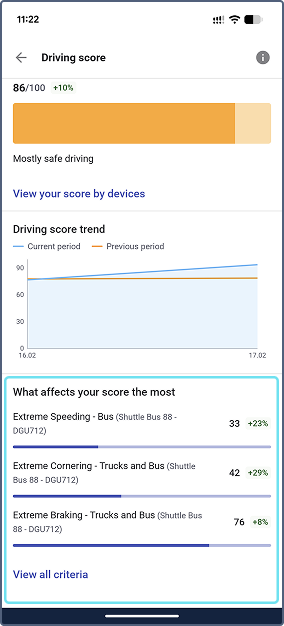
Each criterion shows:
- The criterion name
- The score for that criterion
- The vehicle to which the criterion is assigned
If more than 3 criteria are available, tap View all criteria to see the complete list of criteria sorted by score (from lowest to highest).
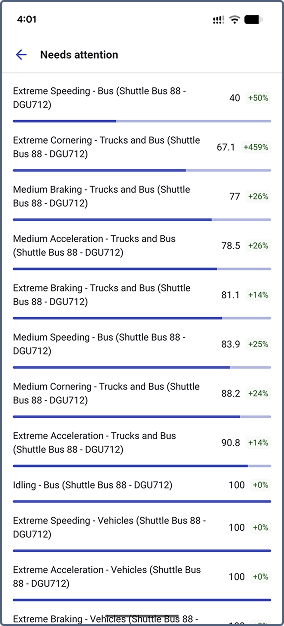
From the full list, tap any criterion to see the violations associated with it.