Dashboard in Wialon Platform Studio
Who can do it: Service provider
Where: Wialon Platform Studio
The Dashboard page in Wialon Platform Studio provides an overview of your customer base, device fleet, and application usage. It contains summary cards and charts organized into the following tabs:
-
Account growth — customer and device statistics.
-
Engagement — application audience and user activity metrics.
Filtering by period
At the top of the page, use the period button to select the time range for the displayed data:
- Year: Displays data for the current calendar year.
- Quarter: Displays data for the current quarter.
- Month: Displays data for the current month.
- Custom: Use the calendar to define a custom date range and click Apply. You can’t select a period longer than 1 year.
When Custom is selected, the system automatically determines how data is grouped in charts and tables based on the length of the selected range:
| Date range | Data grouped by |
|---|---|
| Up to 31 days | Day |
| 32–93 days | Week |
| More than 93 days | Month |
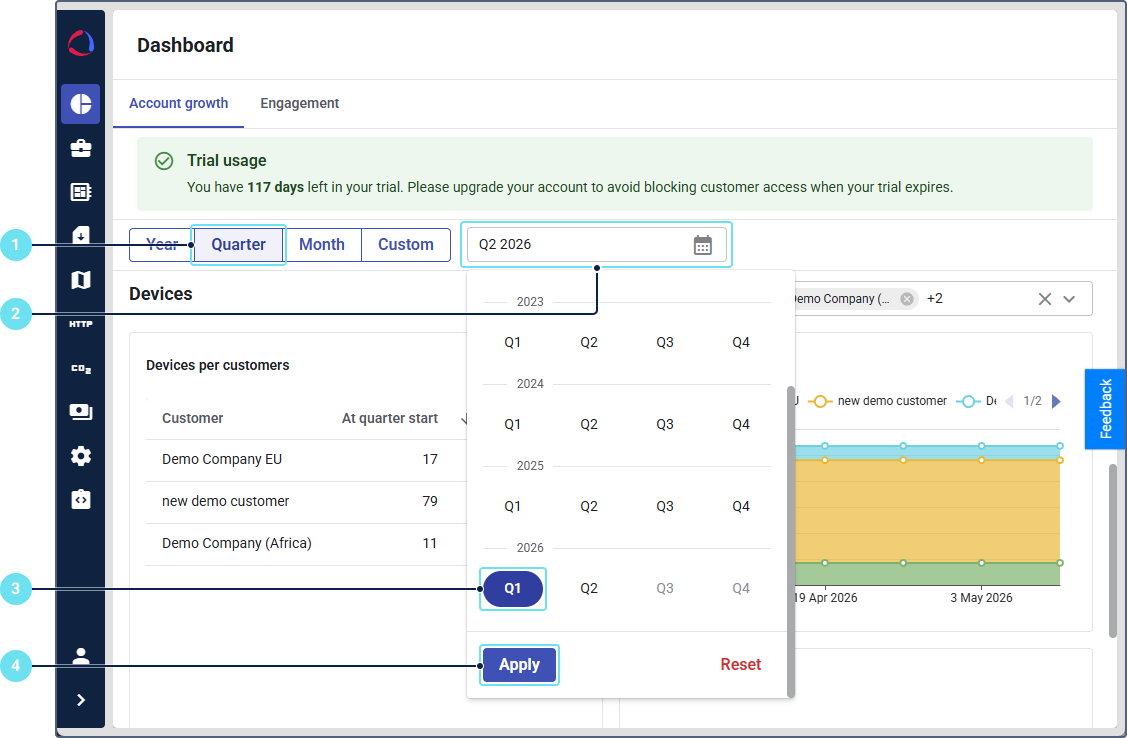
Viewing metrics for previous periods
To view metrics for a previous year, quarter or month, follow the next steps:
-
Select the period, for example, Quarter.
-
Click on the calendar.
-
Select a past quarter, for example, Q1.
-
Click Apply.
To return to the previously selected period, click Reset. The selected period applies to all summary cards and charts on the active tab.
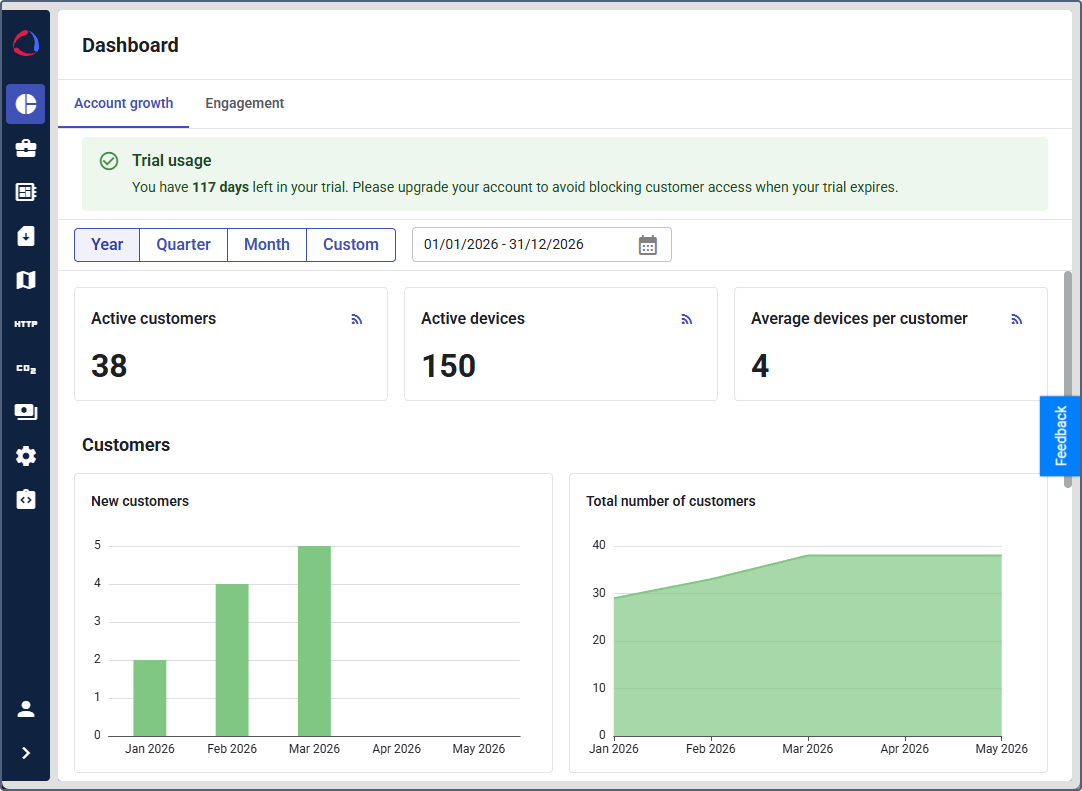
Account growth
The Account growth tab provides statistics on your customers and their devices. It contains the following sections: summary cards, the Customers and Devices sections.
Summary cards
At the top of the tab, three summary cards display key metrics that update in real time:
- Active customers: The current number of active customers.
- Active devices: The current number of active devices across all customers.
- Average devices per customer: The average number of devices per customer.
Customers
The Customers section contains charts that track customer growth:
- New customers: Displays the number of new customers added during the selected period.
- Total number of customers: Displays the cumulative number of customers for the selected period.
Devices
The Devices section contains charts that track device activity.
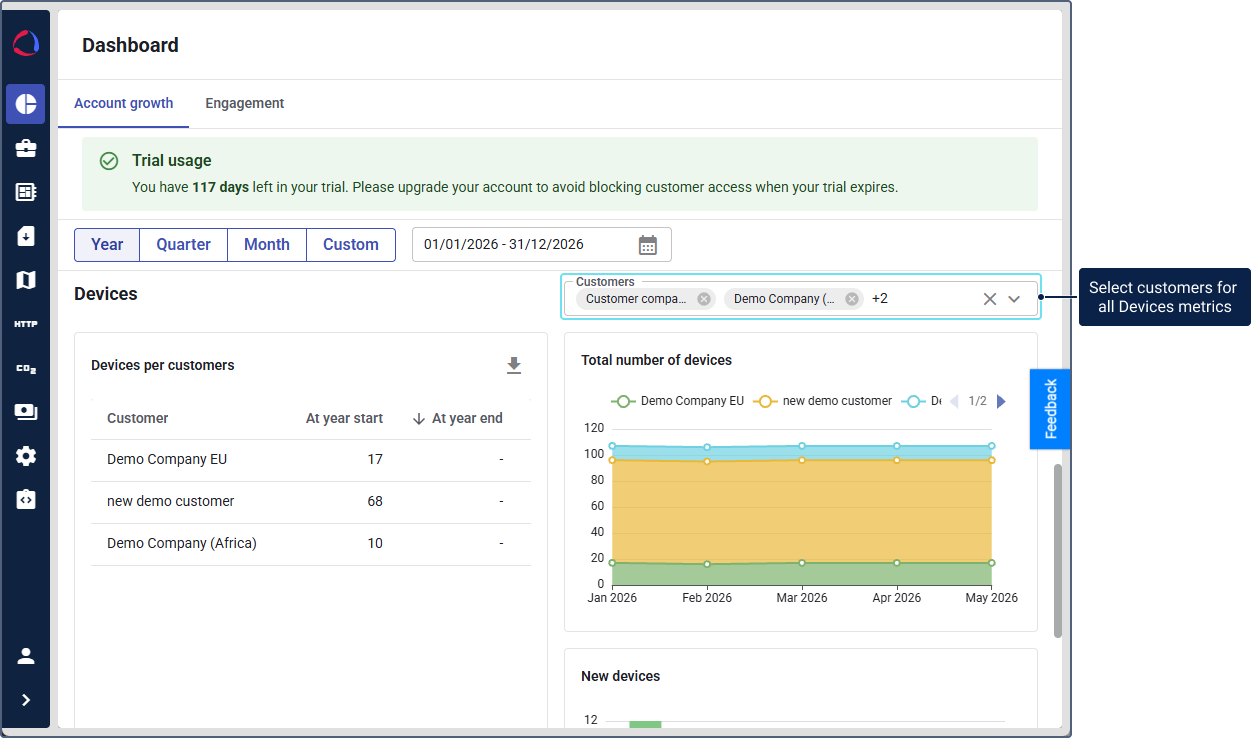
Use the customer filter dropdown to limit the charts to specific customers. You can select multiple customers at the same time.
- Devices per customers: Displays a table of enabled (billable) devices grouped by customer, including the device count at the start and end of the selected period (At period start and At period end columns).
- Total number of devices: Displays the cumulative number of enabled (billable) devices for the selected period.
- New devices: Displays the number of new enabled (billable) devices added during the selected period.
The Devices per customers, Total number of devices, and New devices charts calculate data based only on enabled (billable) devices.
Engagement
The Engagement tab shows application usage metrics, including FleetSpace (Sites) and Wialon Driver (Driver app) activity. It helps you track how actively your customers and their users interact with the standard platform applications and white-labeled applications.
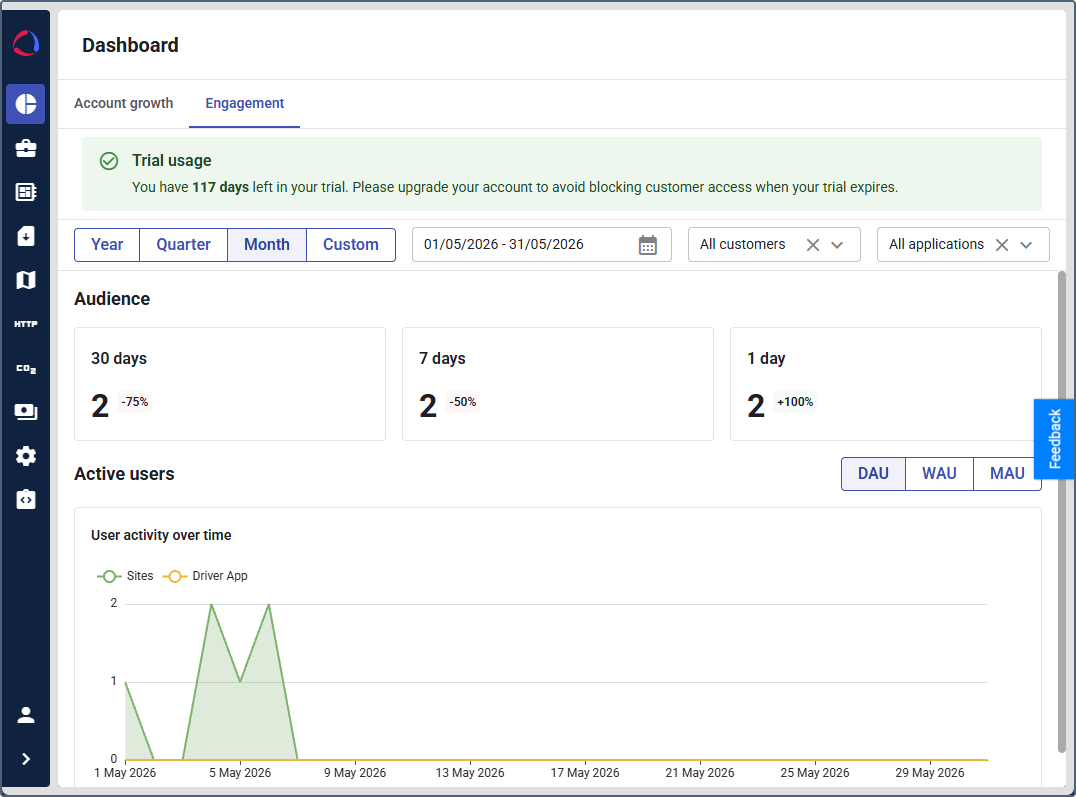
You can use engagement analytics to track customer activity over time using DAU (daily active users), WAU (weekly active users), and MAU (monthly active users) metrics and to identify usage drop-offs that may indicate adoption issues or risk of churn.
Filters
In addition to the period filter, the Engagement tab provides two dropdown filters at the top of the page:
Customers: Limits the displayed data to the selected customers. By default, All customers is selected. Applications: Limits the displayed data to the selected application types (FleetSpace apps and Driver apps).
You can select multiple customers and application types simultaneously. The filters apply to all sections on the Engagement tab.
Audience
The Audience section displays three summary cards showing the number of unique active users for different time windows:
- 30 days: The number of unique users active in the last 30 days (MAU). The percentage indicates the change compared to the previous period. For example, the 30 days card compares the current 30-day window to the preceding 30-day window.
- 7 days: The number of unique users active in the last 7 days (WAU). The percentage indicates the change compared to the previous period.
- 1 day: The number of unique users active during the day (DAU). The percentage indicates the change compared to the previous period.
Active users
The Active users section contains the User activity over time chart. This line chart shows user activity trends broken down by application type. Each application type is represented as a separate line with a distinct color.
Click an application name in the legend to show or hide its line on the chart.
The chart legend lists all tracked applications: FleetSpace applications (Sites) and Wialon Driver (Driver app). The data updates based on the selected period, customer, and application filters.