Adding widgets for parameter monitoring
Who can do it: Service provider
Where: Wialon Platform FleetSpace
You can add widgets to the device detailed view for the Parameter monitoring page. These widgets provide comprehensive information about the selected device and its parameters.
To add the Parameter monitoring page to Wialon Platform FleetSpace, use the Configuring the “Parameter monitoring” page guide.
To add the parameter monitoring widgets:
- Click the icon
 to enable the editor mode on the Parameter monitoring page.
 - Click on any device to open its detailed view. The detailed view appears as a drawer on the right.
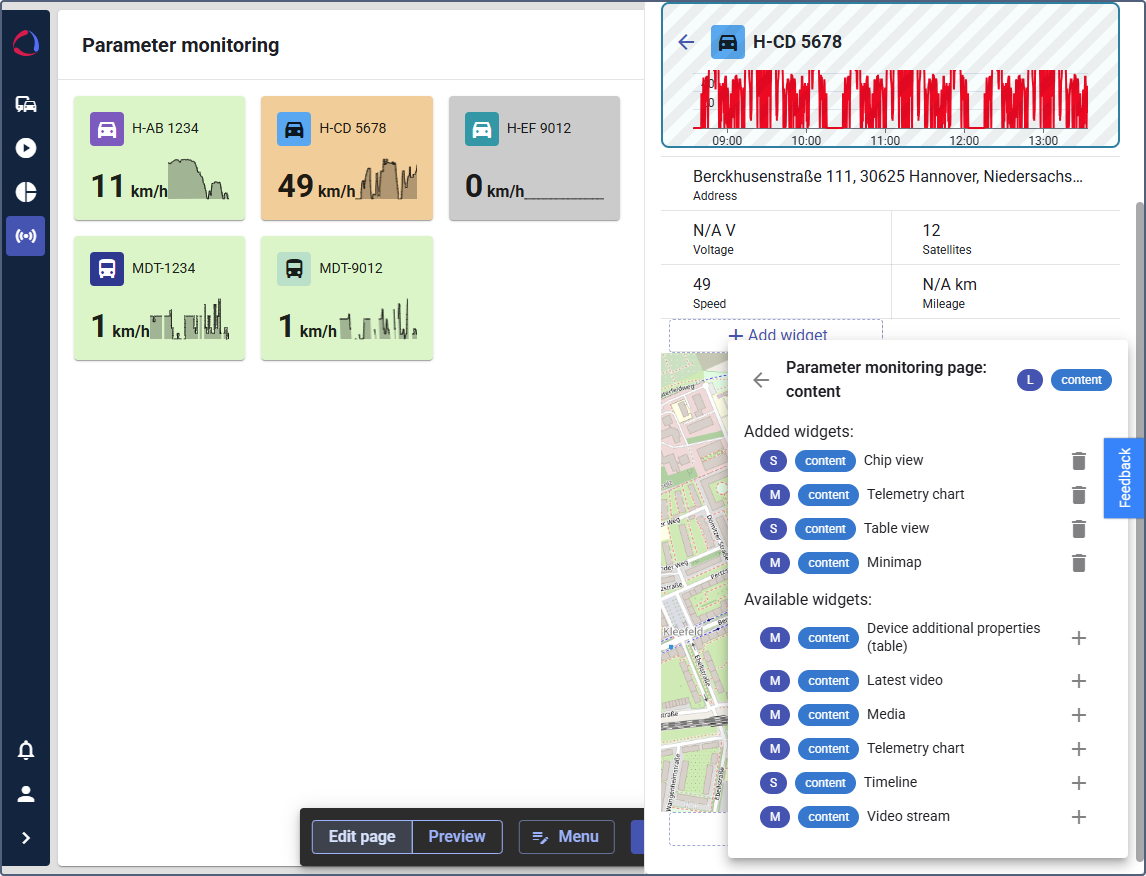
- Locate and click the Add widget button.
You will see the Parameter monitoring page: content window where you can select the widgets.
Parameter monitoring widgets
The Parameter monitoring contents can include the following widgets:
- Chip view, which includes the following chip widgets:
- Assigned driver
- Connection status
- Driving score by vehicle
- Geofence count
- Labels
- Last updated time
- Motion state
- Private use
- Sensor
- Telemetry
- Latest video
- Media
- Table view, which includes the following cell widgets:
- Assigned driver
- Checklist status
- Connection state
- Counter
- Driving score by vehicle
- Geofence count
- Labels
- Last updated time
- Motion state
- Private use
- Sensor
- Telemetry
- Telemetry (chart)
- Timeline
- Vehicle additional properties (table)
- Video stream
See the device widgets description on the Customizing devices in Wialon Platform FleetSpace page.
To quickly find the widget in the list, start typing its name in the Search bar. You can add and configure new widgets by clicking the icon  . next to the desired widget. The added widgets are displayed in the Available widgets list.
See how to configure the Timeline widget on the Enabling trip chips and widgets page.
The widgets you have added appear for all devices when you click their tiles on the Parameter monitoring page.