Setting up widgets in the device details
Who can do it: Service provider
Where: Wialon Platform FleetSpace
Widgets enhance the device card by providing quick-access actions or displaying real-time data directly in the device details. In the device details, you can add chips, cells and widgets and change their order.
The list of available widgets depends on the modules enabled for the customer.
If a widget was previously added but its module is now disabled, it remains visible as unavailable (greyed-out text). You can reorder or delete such widgets, but to restore them later, enable the corresponding module (by assigning a suitable billing plan and making sure the feature is enabled in the Features section) or switch to a customer that has it enabled.
After adding all the necessary widgets, you can preview the changes in the workspace. To do this, switch to Preview mode using the button  in the editor mode toolbar and select a user from the user preview dropdown to simulate their session.
See the complete list of available device widgets on the Customizing devices in Wialon Platform FleetSpace page.
The widgets described below are available in web and mobile versions.
Adding the “Timeline” widget
The Timeline widget provides a visual summary of the device activity over a recent period.
- Click Add widget in the device details.
- Select the Timeline widget.
- Select the data you want to display on the timeline. You can select up to 3 data types from the available ones.
- Click the icon
 to apply the changes to all the devices.
Adding the “Device additional properties” widget
The Device additional properties widget displays custom properties of the device (for example, SIM card number, unique device ID). To add the widget:
- Click Add widget in the device details.
- Under the Available widgets section, locate the Device additional properties widget.
- Click the icon
 next to it.
 - Click the icon to add it to the Added widgets list.
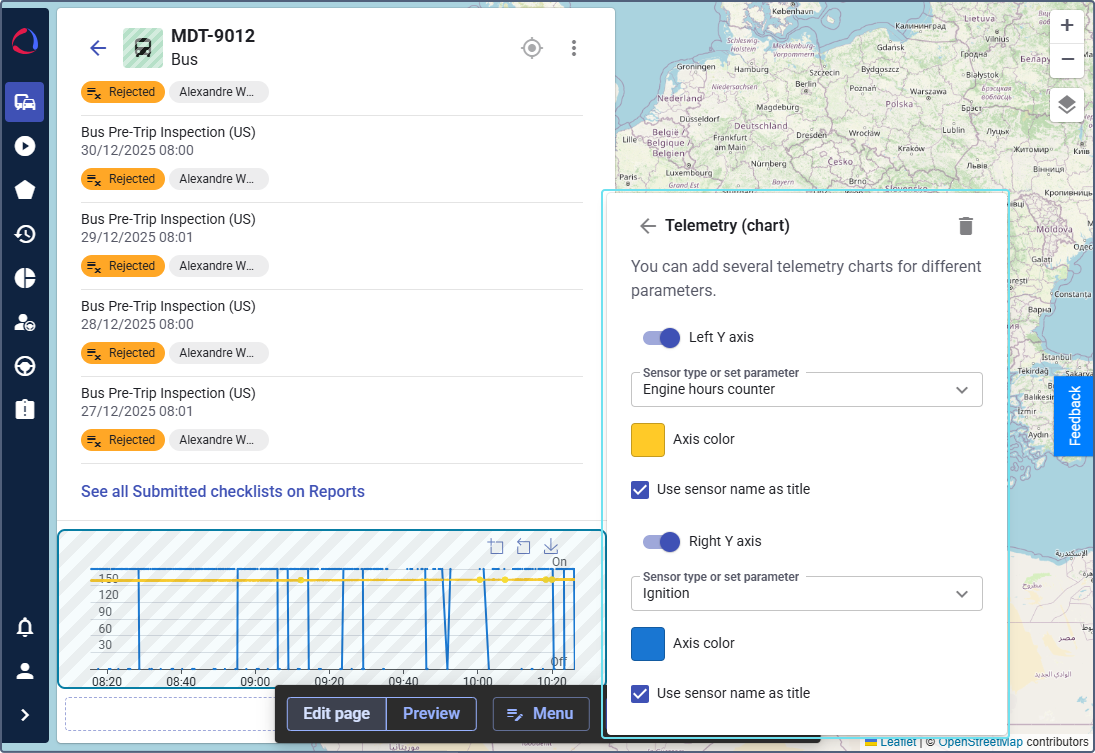
Adding the “Telemetry (chart)” widget
To add the Telemetry (chart) widget:
-
Click the icon
. next to Telemetry (chart). -
Toggle the Left Y axis option.
-
Select the sensor type or the parameter you want to display in the left axis of the chart. To display a parameter, select the Set parameter manually option.
-
(Optional): If you use the Set parameter manually option, fill in the following fields:
- Parameter system name: Enter the name of the parameter you want to display. For example,
position.speed, will display the device speed. - Title: Sets the label for the axis, which is displayed on the chart, for example,
Speed. For example,position.speed, will display the device speed.
- Parameter system name: Enter the name of the parameter you want to display. For example,
-
Pick the color for the chart line and click Apply.
-
Enable the Use sensor name as title toggle to automatically use the sensor template name as the widget title. If you disable it, you can enter a custom Title.
-
Toggle the Right Y axis option and configure it the same way as the left Y axis.
-
Click the icon
to save the widget configuration.
This single chart displays two different sets of data with their own scales and colors, making it easier to monitor their relationship and identify any correlations.
Adding cells to device details
In the device details, you can add cell widgets to show key device information in a table format (for example, status, driver, labels, scores, checklist status).
- Navigate to the Devices page from the sidebar.
- Click on any device in the list to open the details view.
- Click the icon
 in the sidebar to enable the editor mode.
 - Cell widgets are added inside the Table view widget, which works as a container. If Table view isn’t added yet, add it first. Click Add widget inside the Table view container.
- In the list of available widgets, find the necessary cell type and click the icon next to it.
You can add and combine the following cell widgets (availability depends on enabled modules and configured data):
- Assigned driver (cell)
- Checklist status (cell)
- Connection state (cell)
- Counter (cell)
- Driving score by device (cell)
- Geofence count (cell)
- Labels (cell)
- Last updated time (cell)
- Motion state (cell)
- Private use (cell)
- Sensor (cell)
- Telemetry (cell)
Use search by widget name to quickly find the required widget. You can add as many cell widgets as required.
When you configure the table in the editor mode, some cells may not have data at the moment (for example, if the required sensor isn’t configured for the device). In editor mode, such cells remain visible and show
N/A. Outside editor mode, cells without data are hidden.
Configuring the “Telemetry (cell)” widget
The Telemetry (cell) widget displays a specific data point from a device, such as the number of satellites, voltage, or any other parameter, in a human-readable format.
To configure the Telemetry (cell) widget, follow these steps:
- Parameter system name: Select the telemetry parameter you want to display from the dropdown list (for example,
power.voltage). - Title: Enter a descriptive title that appears at the top of the widget (for example,
Voltage). - Unit of measurement: Enter the unit for the parameter value (for example,
V). - Size: Select the widget size: Compact (half a row) or Expanded (entire row).
- (Optional): In the Value ranges section, assign icons and colors to value ranges to visually distinguish different states. Click the icon to add a new range, set a threshold value, and pick an icon and color. The widget displays the icon and color that match the current value.
- Click the icon to add the cell.
Configuring the “Sensor (cell)” widget
The Sensor (cell) widget displays data from a pre-configured sensor in the device details view. You can add several Sensor cells for different sensor types.
To configure the Sensor (cell) widget, set the following options:
- Sensor type: Select the type of sensor you want to display from the dropdown list (for example, Engine temperature).
- Use sensor name as title: Enable this toggle to automatically use the sensor template name as the widget title. If you disable it, you can enter a custom Title.
- Size: Choose the widget size (1 for a half line or 2 for a whole line in the table).
- Click the icon to confirm the widget configuration.
After saving, the Sensor (cell) widget appears in the device details, displaying real-time data from the selected sensor.
Configuring the “Counter (cell)” widget
The Counter (cell) widget displays data from pre-configured Engine hours counter and Mileage counter in the device details view.
To configure the Counter (cell), set the following options:
- Select the type of counter you want to display: engine hours or mileage.
- Choose the widget size (1 or 2).
- Click the icon to confirm the widget configuration.
Managing widgets in the device details
To find the necessary widget by name, use the Search bar in the list of widgets.
You can customize the data recency, order and the layout of elements using the settings in the editor mode:
-
Click on the device details to enter the Device card settings. In the Time range (hours) field, enter the period for which you want to display data in the added widgets.
-
Change the order of the added widgets by dragging and dropping them using the icon
 in the settings. You can also drag and drop the added widgets directly in the device details.
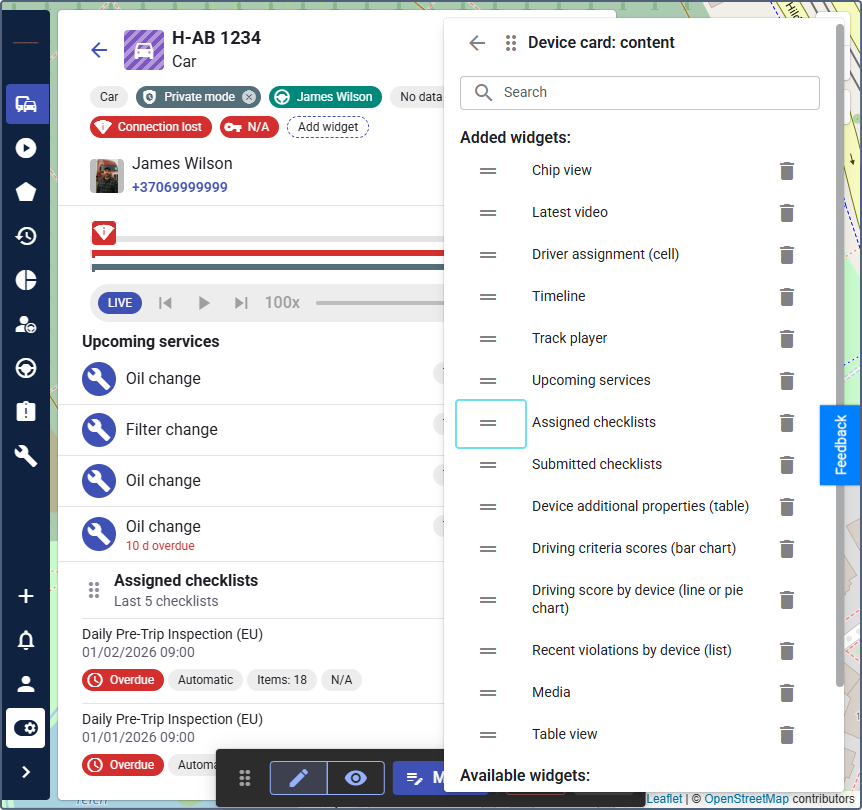
If a widget is outdated, the icon
will appear next to it in the editor mode. Once you delete a deprecated widget, you will not be able to add it again.