Viewing device data
Who can do it: Service provider
Where: Wialon Platform Studio
The Data tab in the device details is used for technical diagnostics. It shows the data received from the device in the Messages, Chart and Raw views.
To open it, go to the Devices page, click the required device in the list, and switch to the Data tab.
By default, the tab shows the data received during the last two hours. You can change this period using the date picker.
Messages
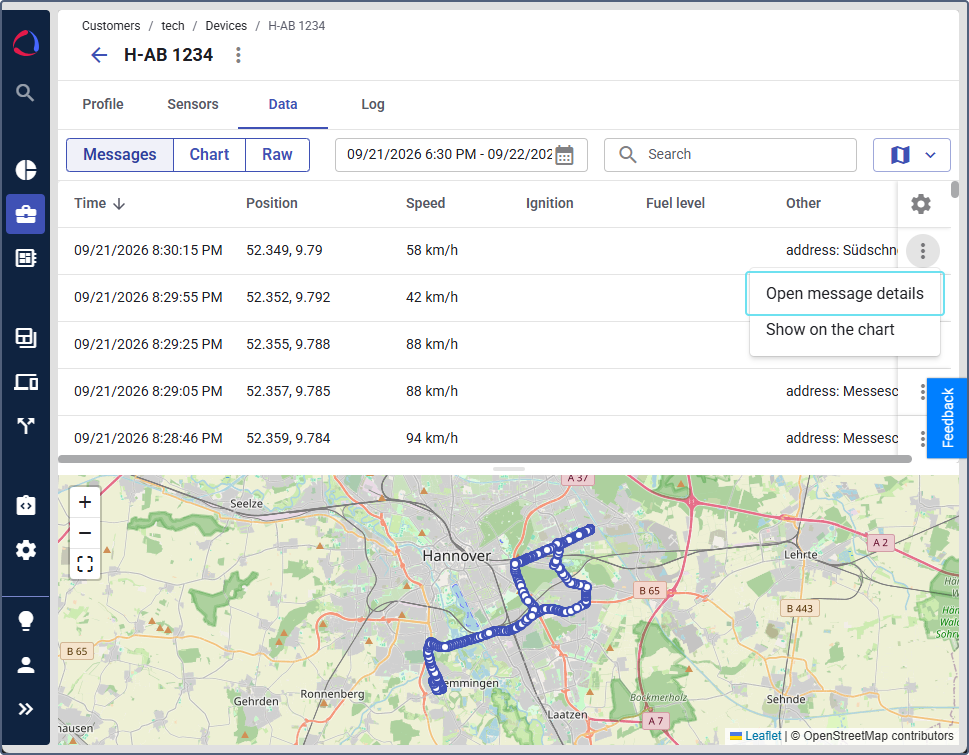
The Messages view allows you to check the parsed messages received from the device. The messages are listed in a table with fields such as Time, Server time, Speed, Address, Satellites, and Other data. To use the view:
-
In the date picker, select the period for which you want to see the received messages. Click Apply.
-
Click the icon
 in the message row.
 -
Select Open message details.
-
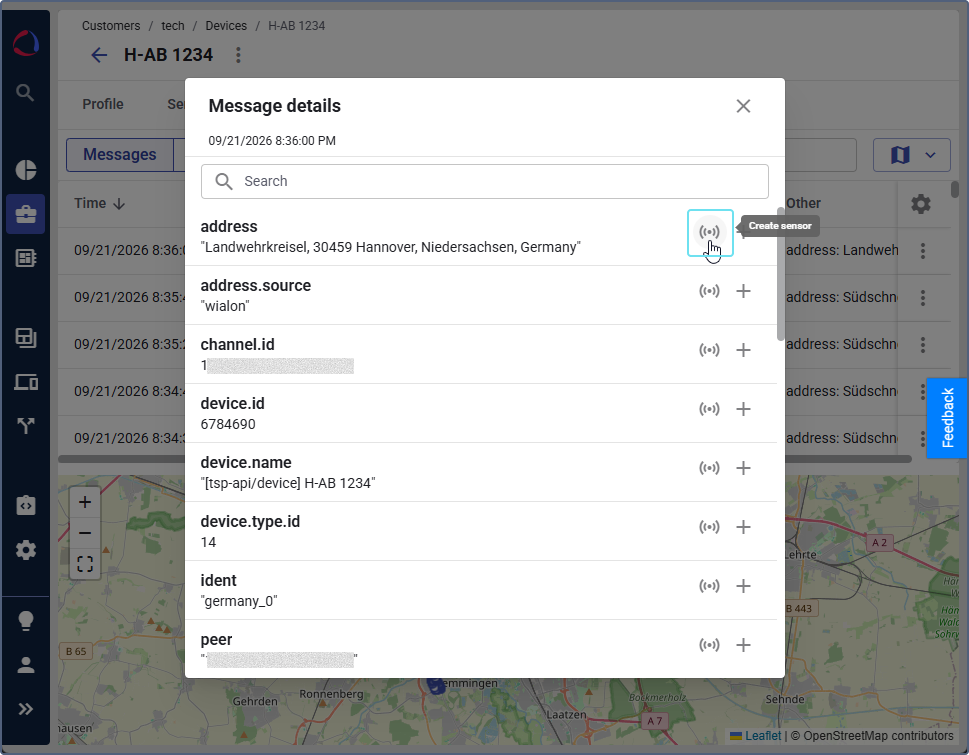
See the parsed parameters in the Message details section. To quickly find the required parameter, start typing its name in the search field.
-
Verify the device data.
Creating sensors from messages
You can create sensors from parameters in the Message details section. To do this, click the icon  , select the sensor type and give it a name.
Chart
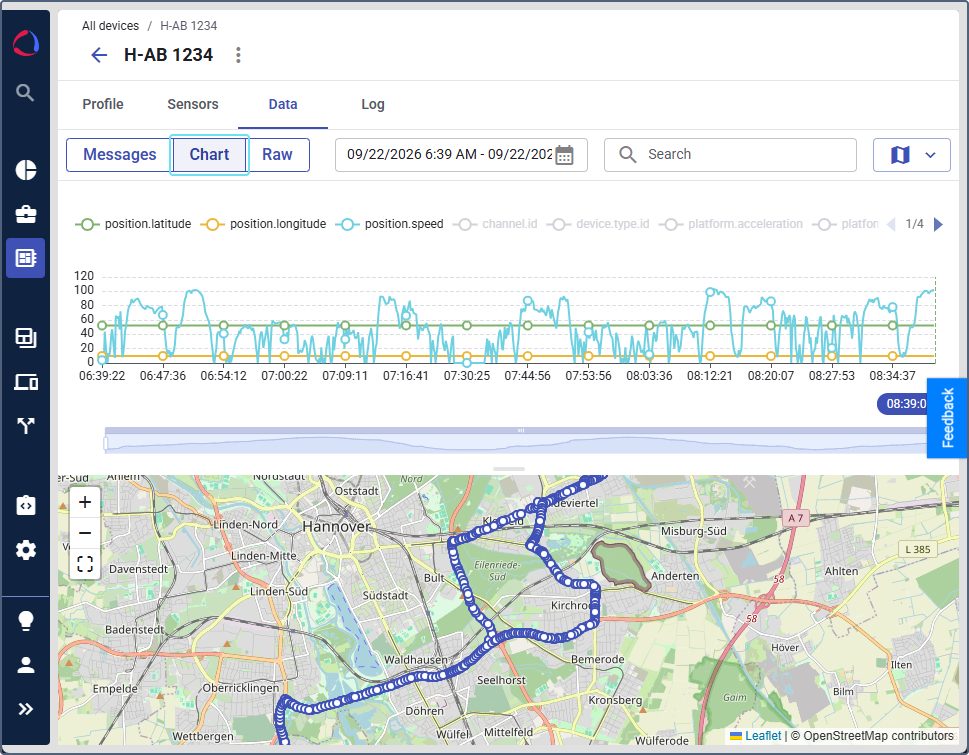
The Chart view shows how the values of the device parameters changed over the selected period. Use it to compare several parameters on one timeline and find the moments when the device reported unexpected values.
To build and analyze a chart:
- In the date picker, select the period you need and click Apply.
- In the legend above the chart, click the parameters you want to display, for example,
position.speed. The selected parameters are highlighted in color, and the others stay grey. - To see the rest of the parameters, use the arrows on the right of the legend. The indicator next to them shows the current page and the total number of pages.
- Point to the chart to see the values of the selected parameters at a specific moment.
Each parameter is drawn as a separate line with its own color. The horizontal axis shows the time of the messages, and the vertical axis shows the parameter values.
To zoom in on a part of the period, use the slider below the chart: drag its edges to narrow the range or move it to shift the range without changing its length.
Viewing the track
Below the chart, you can see the track built from the messages of the selected period. Each point on the track is a message. Click a point to see the values reported at that moment.
To show or hide the map, click the map button  and select how to display the map: No map, Map under the rows or Map bedise the rows.
Raw
The Raw view shows the data packets as the platform receives them from the device. It can be used by developers and support staff to troubleshoot connectivity issues and verify the raw data stream.
The data is shown with timestamps (for example, 2025-10-28 18:41:51.106 +02) and indicates whether the packet was sent or received, along with the size and the raw hexadecimal content of the packet.