Creating a custom report
Who can do it: Service provider
Where: Wialon Platform Studio
On the Analytics page, you can configure custom reports for your customers. You can select what data should be included in a custom report, how it should be structured, and what summary metrics should be shown.
The analytics builder is organized into configuration sections and includes a preview panel.
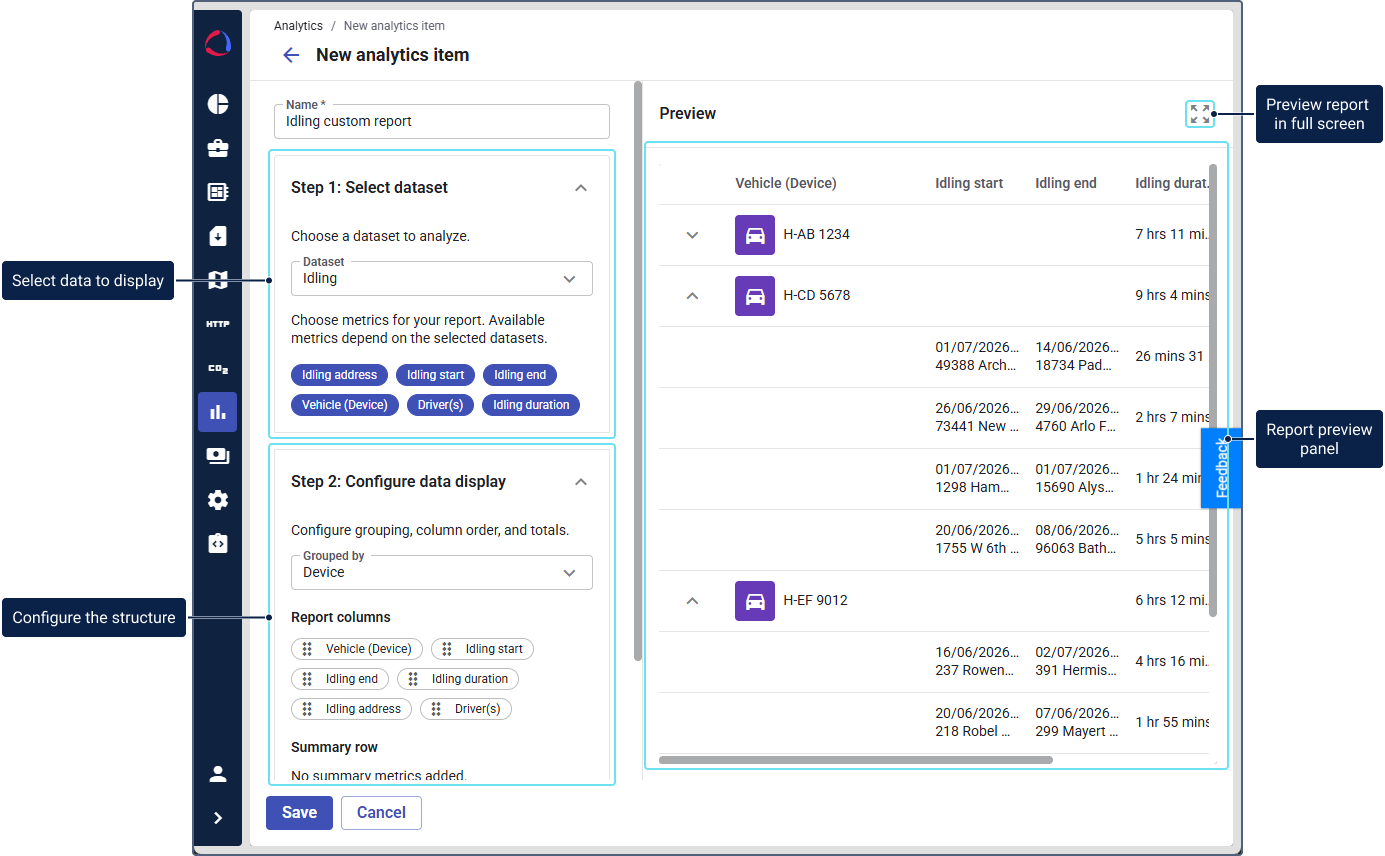
To set up a custom report, follow the steps below.
Step 1: Select dataset and choose metrics
-
In Wialon Platform Studio, expand the Resources section in the navigation menu.
-
Open the Analytics page.
If you haven’t created any analytics items yet, click Add first analytics item on the empty page.
-
Click New analytics item.
-
In the dropdown, select New report.
-
Enter a name in the Name field. This field is mandatory. Customer users can find the custom report in Wialon Platform FleetSpace using this name.
-
In the Select dataset and choose metrics section, open the Dataset dropdown and select the data type to analyze.
The following datasets are available:
- Idling: Data about device idling events.
- Parking: Data about parking events.
- Trips: Data about trip events.
-
Choose the metrics you want to include as report columns by clicking on the chips. Selected metrics are highlighted.
The available metrics depend on the selected dataset:
| Dataset | Available metrics |
|---|---|
| Idling | Idling address, Idling start, Idling end, Device, Driver(s), Idling duration |
| Parking | Parking address, Parking start, Parking end, Device, Driver(s), Parking duration |
| Trips | Mileage, Average speed, Start address, End address, Device, Driver(s), Trip duration, Max speed, Trip started at, Trip ended at, Fuel consumption (Sensor), Engine hours (Sensor). |
To use metrics such as Fuel consumption (Sensor) and Engine hours (Sensor), the corresponding sensors must be configured for devices. In the report, fuel consumption is displayed in liters and engine hours are shown in hours.
The Fuel consumption (Sensor) metric uses data from the Fuel consumption volume sensor only. If a device has just a Fuel consumption rate sensor (L/100 km), the metric stays empty for that device.
To change the term Device to a preferred term for a customer, for example Vehicle, Ship or Plane, follow the instructions. The changes are applied to the customer’s reports in Wialon Platform FleetSpace.
Changing the dataset after selecting metrics cancels your column configuration. Confirm resetting the configuration before applying the change.
Step 2: Configure data display
After selecting metrics, expand the Configure data display section to configure grouping, column order, and summary metrics.
Grouping
Use the Grouped by dropdown to select how the report data is grouped:
- None: Data is displayed as a list without grouping.
- Driver: Data is grouped by driver.
- Device: Data is grouped by device.
The available grouping options depend on the selected dataset and metrics.
Column order
To configure the order of the report columns, drag the column chips into the required order.
Summary row
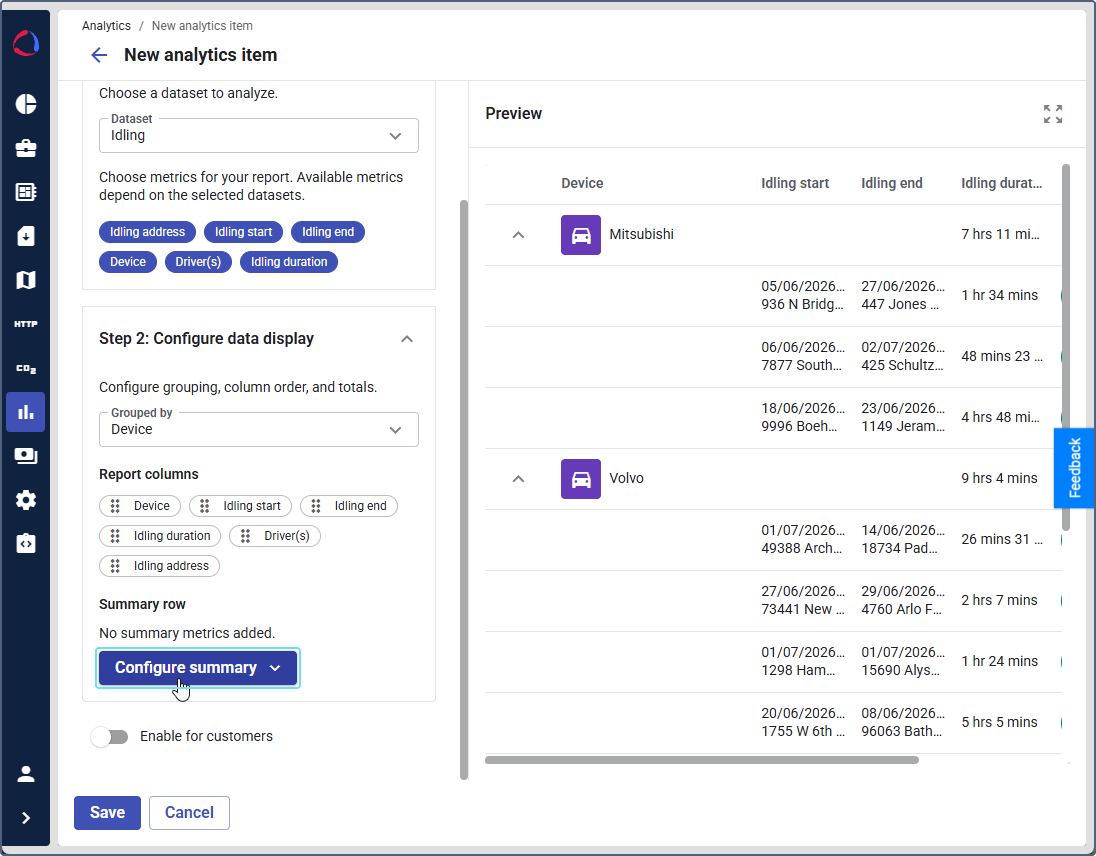
The summary row displays aggregated values at the top of the report. To configure it:
-
Click Configure summary.
-
In the panel that opens, select the summary metrics you want to include.
Each metric is available in two aggregation types:
- Total: The sum of all values in the column.
- Average: The average of all values in the column.
Use the search field at the top of the panel to find specific metrics. The counter shows how many metrics are currently selected.
-
Click Apply to save your selections.
Only columns that support aggregation are available for the summary row. You can include both Total and Average for the same column.
Previewing the item
The Preview panel shows the report structure with sample data.
Use the icon  in the top-right corner of the preview panel to view it in full screen.
To enable analytics items for customers, make sure that the Analytics builder feature is included in the customer billing plan and the Enable for customers toggle is turned on on the Analytics page. See the full guide: Enabling analytics items for customers.