Monitoring tachograph data with widgets
Who can do it: Service provider, Customer
Where: Wialon Platform FleetSpace
All the widgets on this page are built from the downloaded tachograph files, so they stay empty until the first files are received. Live tachograph data is shown in other places: on the Live tab, in the driver details, and in the Wialon Driver mobile app. For details, see Viewing live tachograph data.
Widgets let you keep tachograph data in front of you on the pages you work with every day, without opening the Tachograph control page. Pick a widget by the task you need to solve:
| Task | Widget | Where |
|---|---|---|
| Check the download deadline of a single driver or device | Tacho file (chip and cell) | Device and driver lists and details |
| See how the whole fleet keeps to the download intervals | File compliance (value card) | Dashboard |
| Watch how many driving and rest rule violations your drivers commit | Tacho infringement count (value card) | Dashboard |
| See which severities and types of infringements prevail in your fleet | Tacho infringements by severity or type (bar chart) | Dashboard |
| Find the drivers who commit the most infringements | Drivers with tacho infringements (list) | Dashboard |
| Check whether the number of infringements grows or falls | Tacho infringement trends (list) | Dashboard |
| Get the last tachograph file of a driver | Driver latest tachograph file | Driver details |
All these widgets are added in the editor mode and aren’t included in the default workspace. A service provider must add them for each workspace where they should be shown.
Checking the deadline of a driver or device
The Tacho file widget shows the download deadline status next to a driver or device name, as a chip or as a cell. For the statuses and the color coding, see Deadline widgets in device and driver lists.
Checking the download compliance of the fleet
The File compliance (value card) widget shows one summary value on the Dashboard: the download compliance rate, the number of downloads due soon, or the number of overdue downloads. For the widget values and the details view, see “File compliance” dashboard widget.
Watching the number of infringements
The Tacho infringement count (value card) widget shows how many infringements of driving and rest rules were detected in your fleet, so you can follow the trend without generating the Tachograph infringements report.
This widget also requires the Drivers module enabled for the customer account and the Read permission on drivers, because infringements are recorded for drivers.
To add the widget, find it in the Tachograph section of the Add to dashboard panel. See Setting up widgets on the Dashboard for the instructions.
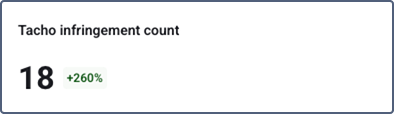
The card shows the number of infringements for the analysis period selected on the Dashboard and the difference compared with the previous period of the same length. Only the infringements of the drivers you have access to are counted, and the vehicle type filter doesn’t affect the value. You can add this widget to the Dashboard only once.
Click the card to see how many infringements each driver has. The chips at the top show the selected period and the number of drivers in the list.
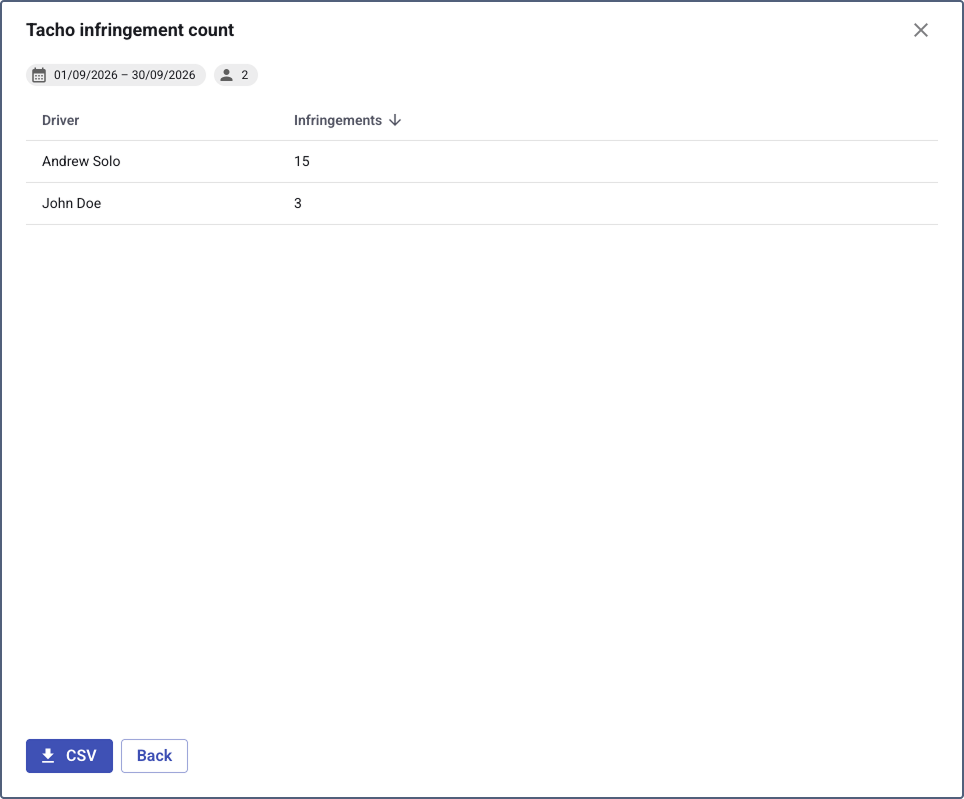
| Column | Description |
|---|---|
| Driver | The name of the driver. |
| Infringements | The number of infringements detected for this driver in the selected period. |
You can sort the data by clicking a column header and download it in CSV format. If there are no infringements for the selected period, the widget shows zero and the details don’t open.
Analyzing infringements by severity and type
The Tacho infringements by severity or type (bar chart) widget shows how the infringements of your fleet are distributed, so you can see at a glance whether, for example, the most serious violations prevail or whether most of them are rest time violations.
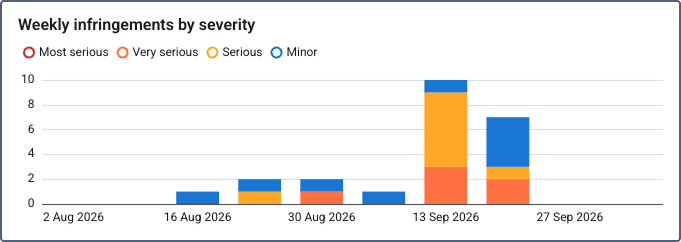
To add the widget, find it in the Tachograph section of the Add to dashboard panel. See Setting up widgets on the Dashboard for the instructions.
In the Group by dropdown, select how the bars are built:
| Group by | Description |
|---|---|
| Severity | One bar for each severity level: Most serious, Very serious, Serious, and Minor. |
| Infringement type | One bar for each type of the broken rule, for example, Weekly driving limit exceeded. |
The height of a bar is the number of infringements detected in the analysis period selected on the Dashboard. You can add this widget to the Dashboard several times, for example, to show both groupings side by side.
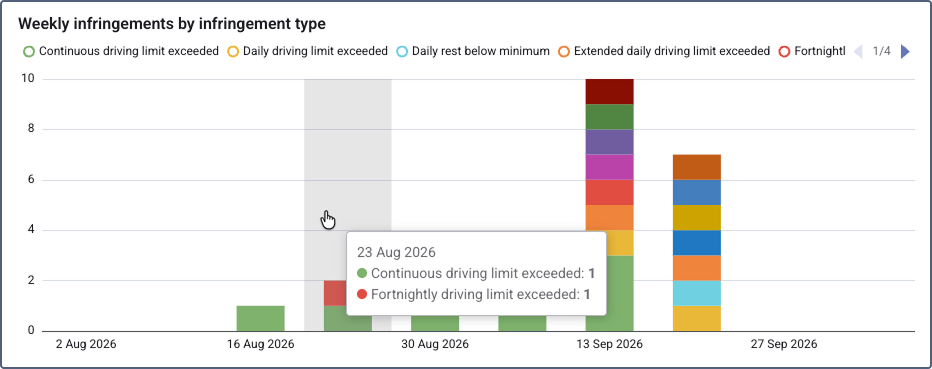
Click a bar to see the infringements behind it:
| Column | Description |
|---|---|
| Driver | The name of the driver who committed the infringement. |
| Infringement type | The rule that was broken. |
| Severity | The severity of the infringement. |
| Begin, UTC | The date and time when the infringement started. |
| End, UTC | The date and time when the infringement ended. |
| Duration | How long the infringement lasted. |
You can sort the data by clicking a column header and download it in CSV format. To continue the analysis, open the Tachograph infringements report from the details: it opens with the same period and filters already applied.
Finding the drivers with the most infringements
The Drivers with tacho infringements (list) widget shows which drivers break the driving and rest rules and how serious their violations are, so you don’t have to check the drivers one by one.
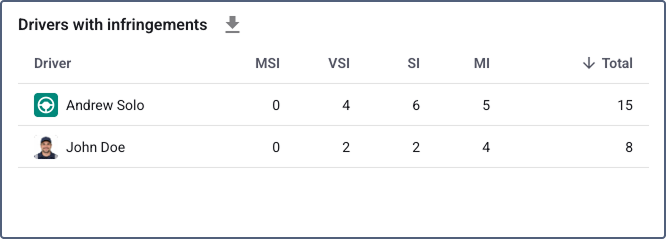
To add the widget, find it in the Tachograph section of the Add to dashboard panel. See Setting up widgets on the Dashboard for the instructions. You can add it to the Dashboard only once.
The table contains the following columns:
| Column | Description |
|---|---|
| Driver | The name and the photo of the driver. |
| Total | The total number of the driver’s infringements in the period. |
| MSI | The number of the most serious infringements. |
| VSI | The number of very serious infringements. |
| SI | The number of serious infringements. |
| MI | The number of minor infringements. |
By default, the drivers are sorted by the Total column, from the highest number of infringements to the lowest. The drivers without infringements in the selected period aren’t shown.
Click a row to see the infringements of this driver for the same period, or to open the Tachograph infringements report with the driver and the period already selected. You can sort the data by clicking a column header and download both the table and the details in CSV format.
Checking whether infringements grow or fall
The Tacho infringement trends (list) widget compares the selected period with the previous one of the same length, so you can see whether the situation in your fleet improves or gets worse.
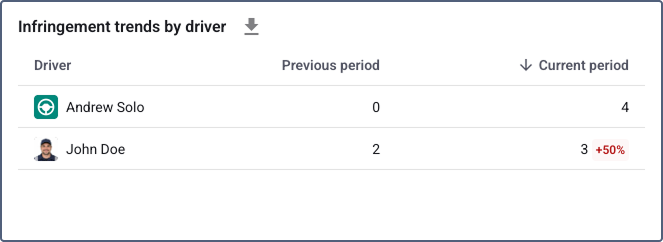
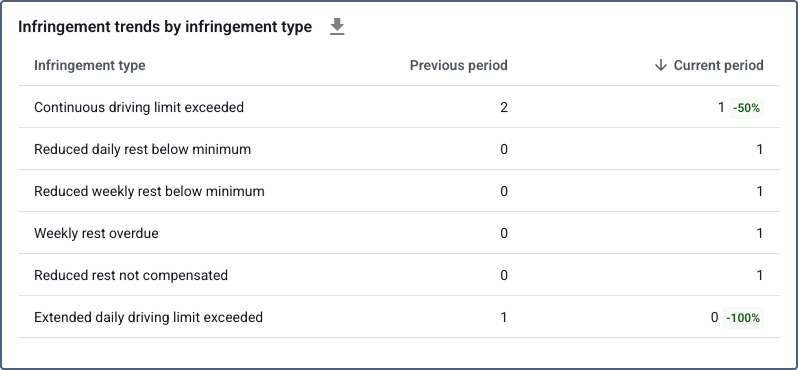
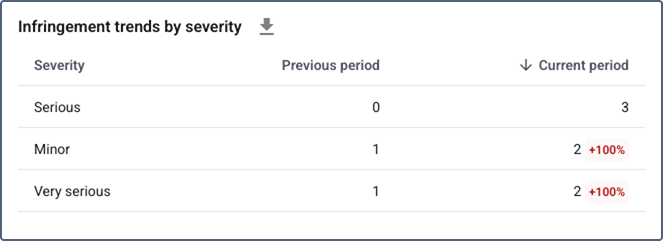
To add the widget, find it in the Tachograph section of the Add to dashboard panel. See Setting up widgets on the Dashboard for the instructions. You can add it to the Dashboard several times, for example, to follow the trend by driver and by severity at the same time.
In the Group by dropdown, select what the rows of the table show: Driver, Infringement type, or Severity. When you group by driver, the rows show the driver photos.
| Column | Description |
|---|---|
| Driver, Infringement type, or Severity | The name of the row, depending on the selected grouping. |
| Previous period | The number of infringements in the period before the selected one. |
| Current period | The number of infringements in the selected period, with the change indicator next to it. |
The names of the period columns depend on the analysis period selected on the Dashboard, for example, Previous month and Current month.
The indicator shows how the number of infringements changed, in percent. Red means that the number grew, green means that it fell. If there were no infringements in the previous period, the indicator isn’t shown, because there is nothing to compare with. If the number falls to zero in the current period, the row stays in the table.
Click a row to see the infringements behind it and to open the Tachograph infringements report. You can sort the data by clicking a column header and download it in CSV format. The sorting and the column widths are saved separately for each grouping.
Getting the last file of a driver
The Driver latest tachograph file widget shows the most recent tachograph file downloaded for the driver and lets you download it to your computer without going to the file list.
To add the widget, open the driver details on the Drivers online page and follow the instructions from Adding widgets to the driver details.
The widget isn’t shown for the drivers who have no downloaded files yet. To get the files, request them manually or configure automatic file requests.