Viewing asset movement history in Reports
Who can do it: Service provider, customer user
Where: Wialon Platform FleetSpace
On the Reports page, you can see where an asset moved during a past period. The movement is shown on the floor plan as a track and in the table of messages. Use the page to find out where the asset was at a specific time, how it moved between floors, and which temperature and humidity values its tag reported.
The history belongs to the asset, not to the tag. If you replaced the tag of the asset during the period, the messages from all its tags are shown together as one track, in time order.
The Reports page is available only in Wialon Platform FleetSpace on the web. The Wialon Platform mobile app doesn’t have it.
Building a report
- Go to the Reports page.
- In the Asset field, select the asset. To find it faster, start typing its name or inventory number. If several assets have the same name, use the inventory number shown under the name to tell them apart.
- In the date picker, select the period. The period can’t be longer than one month.
The map and the table load after you select both the asset and the period. The map opens on the building and floor of the first message of the period.
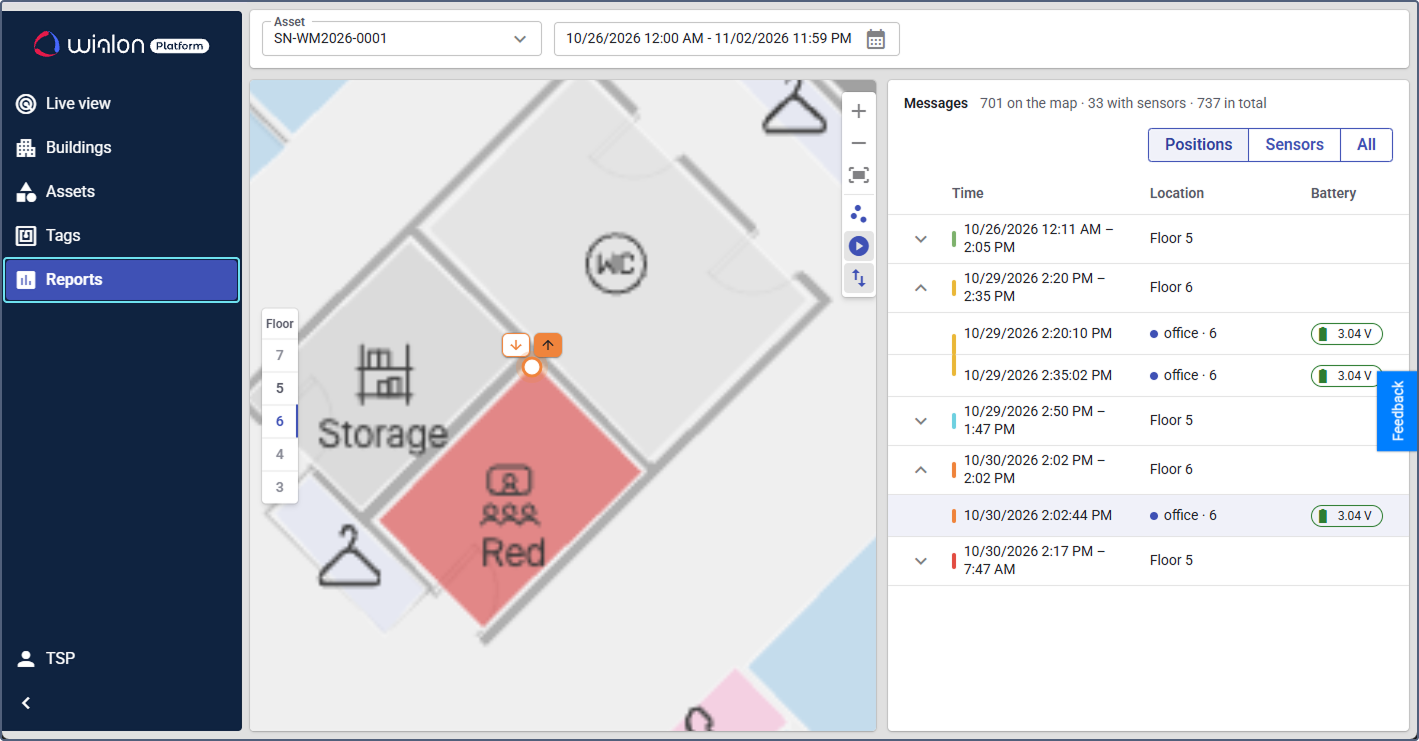
If you change the asset or the period, the data reloads, and the map returns to the building and floor of the first message.
If you go to another page and come back, the selected asset, the period, and the loaded data are kept. After you log out or close the browser tab, they’re reset.
If the asset didn’t send any messages during the selected period, the page shows the No messages for this period message. Select a wider period or another asset.
Viewing the track on the map
The messages of the asset are shown on the floor plan as a track. Each point on the track is a message with a position. The arrows on the track show the direction of movement.
Each visit to a floor is shown as a separate track with its own color. If the asset left the floor and came back later, these visits are shown as separate lines that aren’t connected. The same color marks the visit in the table of messages.
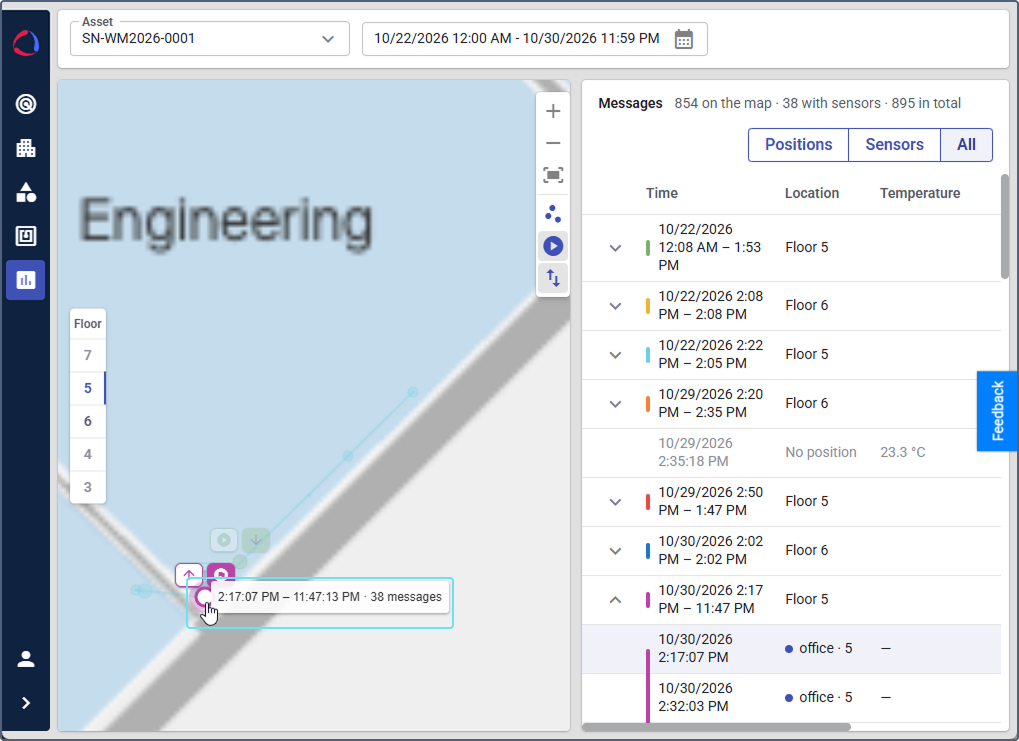
To see the time of a message, point to its point on the track. For a grouped point, you see the time range and the number of messages, for example, 2:17:07 PM – 11:47:13 PM · 38 messages.
Adjusting message display on the map
On the map, you can do the following:
- Select the floor where you want to see the track.
- Change how the messages are shown on the track: group close messages into one point, and show or hide the track start and finish and the floor changes.
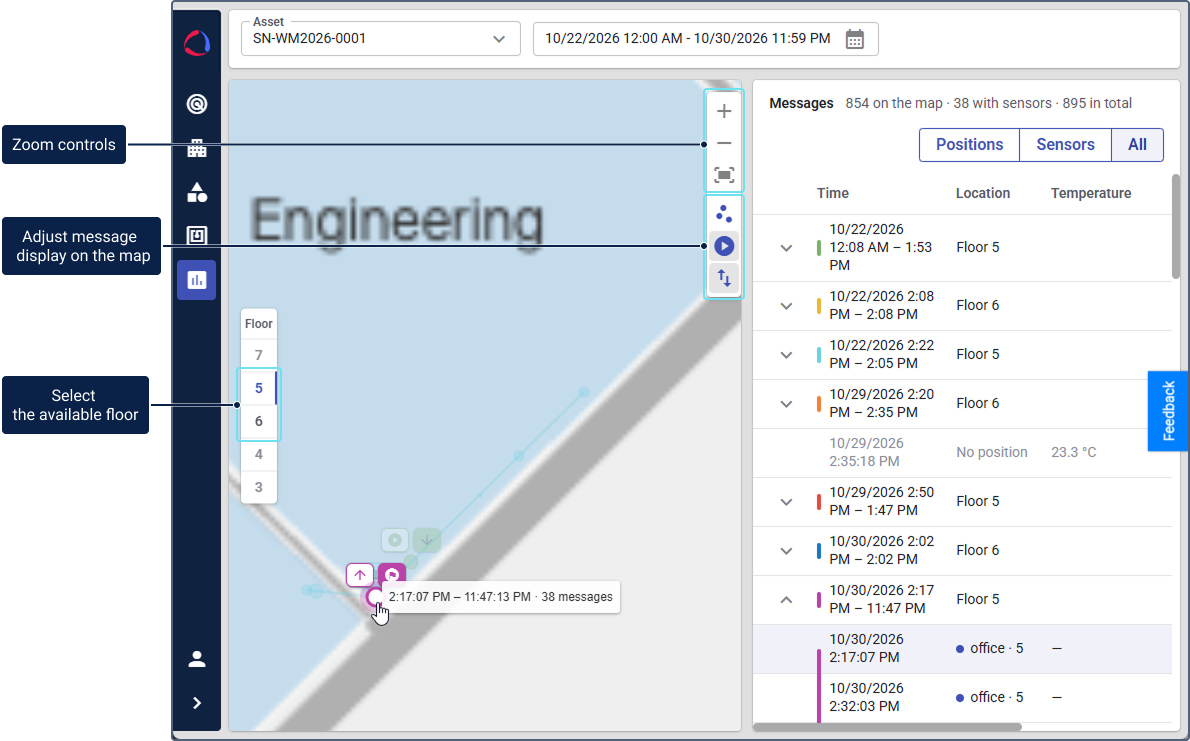
Switching floors
To see the track on another floor, select the floor in the Floor switch on the map. The floors where the asset didn’t send any messages during the period are grayed out, and you can’t select them.
You can also switch between floors and buildings using the table, because the map and the table are linked:
- Click a message in the table to center the map on its point. If the message is from another floor or building, the map switches to it. To open the track in another building, click a message from this building.
- Click a point on the map to find its message in the table. The table scrolls to the message, opens its visit group, and highlights the row.
If you click a grayed-out row in the table, nothing happens on the map, because the message doesn’t have a known position.
Changing how messages are shown on the track
To change how the messages are shown on the track, use the following controls on the map toolbar:
| Icon | Control | Description |
|---|---|---|
 |
Grouping distance | Group the messages that are close to each other into one point. For details, see Grouping messages. |
 |
Track start and finish | Show or hide the icons on the first and last points of the track. For details, see Track start and finish. |
 |
Floor changes | Show or hide the icons that mark floor changes. For details, see Showing floor changes on the map. |
When the Track start and finish or Floor changes option is turned on, its icon is blue. When it’s turned off, the icon is gray. The platform remembers the grouping distance and the selected options.
Grouping messages
When the asset stays in one place, its tag sends many messages with almost the same position. To make the track easier to read, such messages are grouped into one point.
- On the map toolbar, click the icon .
- Move the Grouping distance slider to set the distance in meters.
The messages closer than the selected distance to the first message in a group are shown as one point. To see every message as a separate point, set the distance to 0.
Track start and finish
To see where the asset was at the beginning and at the end of the selected period, click the icon . The first point of the track gets the icon , and the last point is marked as  .
Showing floor changes on the map
When the asset moves to another floor, its track on the current floor ends. To mark such moves, click the icon . The last point before the floor change and the first point after it get icons with arrows. The icons have the same color as the track of the visit.
| Icon | Where it’s shown | Meaning |
|---|---|---|
 Went up to another floor |
On the last point of the visit | The next message is on a higher floor. |
 Went down to another floor |
On the last point of the visit | The next message is on a lower floor. |
 Came from a lower floor |
On the first point of the visit | The previous message is on a lower floor. |
 Came from a higher floor |
On the first point of the visit | The previous message is on a higher floor. |
Viewing messages in the table
The Messages table lists all the messages of the asset for the selected period, in time order. The counters next to the table title show the following numbers:
| Counter | Description |
|---|---|
| On the map | The messages with a position on a known floor. Only these messages are shown on the map. |
| With sensors | The messages with temperature or humidity values. |
| In total | All the messages for the selected period. |
The messages are grouped by floor visits. The row of a group contains a colored stripe (the same color as the track of the visit on the map), the time range of the visit, and the floor. To show or hide the messages of the visit, click the icon  on the left of the row.
Table views
To choose which messages to show, use the buttons above the table:
| View | What it shows |
|---|---|
| Positions | The messages with a position. |
| Sensors | The messages with temperature or humidity values. |
| All | All the messages. This view is selected by default. |
Each view shows only the columns that contain data. You can change the width of the columns. Each view remembers its own column widths.
Table columns
| Column | Description |
|---|---|
| Time | The date and time of the message. In the row of a group, the time range of the visit. |
| Location | In the row of a group, the floor. In the row of a message, the zone and the floor level, for example, office · 6. The dot next to the location marks the messages from the floor that’s open on the map. |
| Temperature | The temperature reported by the tag. |
| Humidity | The humidity reported by the tag. |
| Battery | The voltage of the tag battery. The color of the value shows the battery level. |
If a value isn’t available, the table shows a dash.
Some rows are grayed out. These are the messages without a position (the No position value in the Location column) and the messages from a floor that doesn’t exist anymore. Such messages aren’t shown on the map, but they stay in the table, so you can still see their temperature and humidity values.