Viewing driver activity chronography
Who can do it: Service provider, Customer
Where: Wialon Platform FleetSpace
The chronography shows what a driver was doing on each day, based on the data read from their tachograph card. You can review driving, work, availability, and rest periods, see the events recorded by the tachograph, and check daily and period totals without exporting the files to external tools.
All days and times in the chronography are shown in UTC, and each day covers the period from 00:00 to 24:00 UTC. This matches the way tachographs record data, so the values can be compared with the original tachograph files. If your account time zone differs from UTC, the day boundaries in the chronography don’t match your local ones.
The chronography is built from downloaded tachograph files, not from live telemetry. To see the current status of a driver, use the Live table on the Tachograph control page. For details, see Viewing live tachograph data.
Opening the chronography
- In Wialon Platform FleetSpace, go to the Driver management page.
- Click the driver name to open their details.
- Open the Tacho activity tab.
- Select the period you want to review.
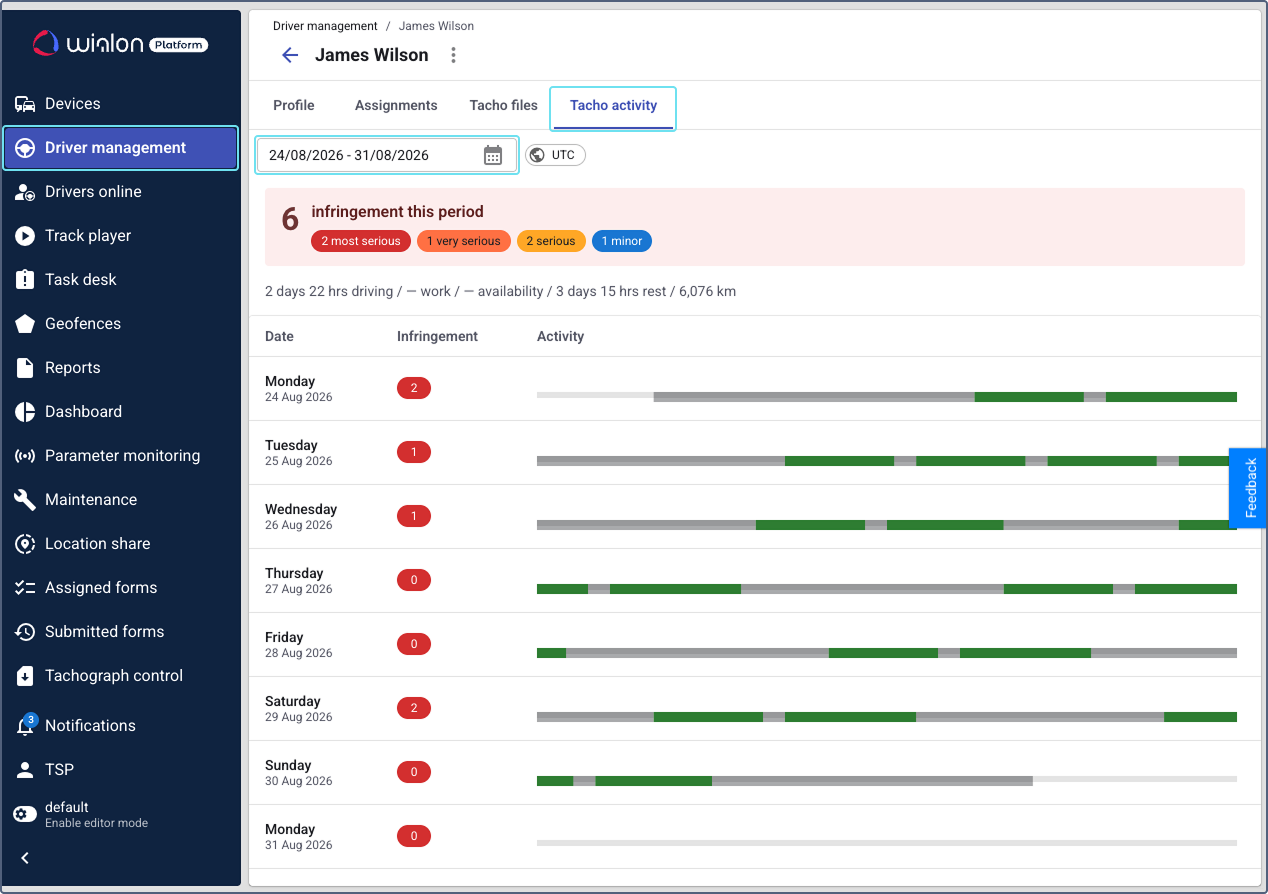
Period summary
Above the list of days, you can see the totals for the whole selected period.
The first line shows how many infringements of EU Regulation 561/2006 were detected, with a color-coded chip for each severity level:
| Severity | Chip color |
|---|---|
| Most serious | Red |
| Very serious | Orange |
| Serious | Yellow |
| Minor | Blue |
The second line shows how much time the driver spent on each activity and the total mileage, for example, 2 days 22 hrs driving / — work / — availability / 3 days 15 hrs rest / 6,076 km. A dash (—) means that there is no time recorded for this activity.
List of days
For each day of the period, the list shows the following:
| Column | Description |
|---|---|
| Date | The day of the week and the date. |
| Infringement | The number of infringements detected on this day. |
| Activity | A color-coded bar with the driver’s activities, drawn to scale from 00:00 to 24:00 UTC. |
The bar shows the following activities:
| Activity | Description |
|---|---|
| Driving | The driver was driving the vehicle. |
| Other work | The driver was working, but not driving, for example, loading cargo. |
| Available | The driver was available for work but not working, for example, waiting at a terminal. |
| Rest | The driver was resting or taking a break. |
To check a single period without opening the day details, point to it on the bar. The tooltip shows the activity name, its start and end time, and its duration, for example, Rest 04:00 – 15:00 · 11 hrs.
Viewing details for a day
To examine a single day, click it in the list. The day details open in a separate window.
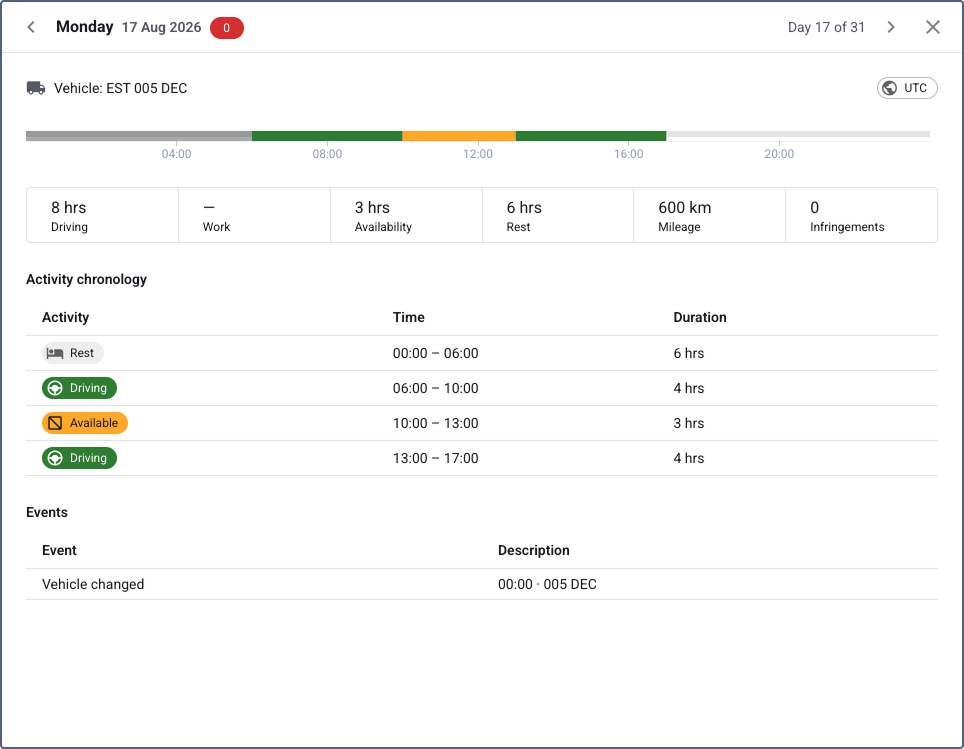
At the top of the window, you can see the day of the week, the date, the number of infringements detected on this day, and the vehicle the driver operated. The vehicle is identified by the registration number recorded on the tachograph card, with the country or region code in front of it, for example, EST 005 DEC.
To move between the days of the period, use the arrows  /
/ . The counter next to them shows which day you are viewing, for example,
 Day 17 of 31. The UTC label reminds you that all times in the window are shown in UTC. You can’t switch the window to another time zone.
Below the header, a color-coded bar shows the whole day from 00:00 to 24:00 UTC, with each activity period drawn to scale.
Day totals
Under the bar, the following totals are shown for the day:
| Total | Description |
|---|---|
| Driving | The total time the driver spent driving. |
| Work | The total time the driver spent working, but not driving. |
| Availability | The total time the driver was available for work but not working. |
| Rest | The total time of the driver’s rests and breaks. |
| Mileage | The distance covered on this day. |
| Infringements | The number of infringements of EU Regulation 561/2006 detected on this day. |
A dash (—) means that there is no time recorded for this activity.
Activity chronology
The Activity chronology table lists all activity periods of the day in chronological order:
| Column | Description |
|---|---|
| Activity | The type of the activity: Driving, Work, Available, or Rest. |
| Time | The start and end time of the period, for example, 06:00 – 10:00. |
| Duration | How long the period lasted. |
If the tachograph card provides no records for the day at all, the window shows only the No data message.
Events
The Events table lists the events recorded by the tachograph on this day:
| Column | Description |
|---|---|
| Event | The type of the recorded event. For the full list, see Events. |
| Description | The time of the event and the details reported by the tachograph, separated by a dot, for example, 00:00 · 005 DEC. |
If no events were recorded on the day, the table isn’t shown.
Infringements
If the driver broke a driving or rest rule on this day, the Infringements section lists the violations. Each of them shows the severity, the type of the infringement, and the article of the regulation, for example, Most serious · Extended daily driving limit exceeded · Reg. (EC) 561/2006 Art. 6.1. Below it, you can see what exactly was recorded, for example, Drove 37 hrs 30 mins with no break or rest at all.
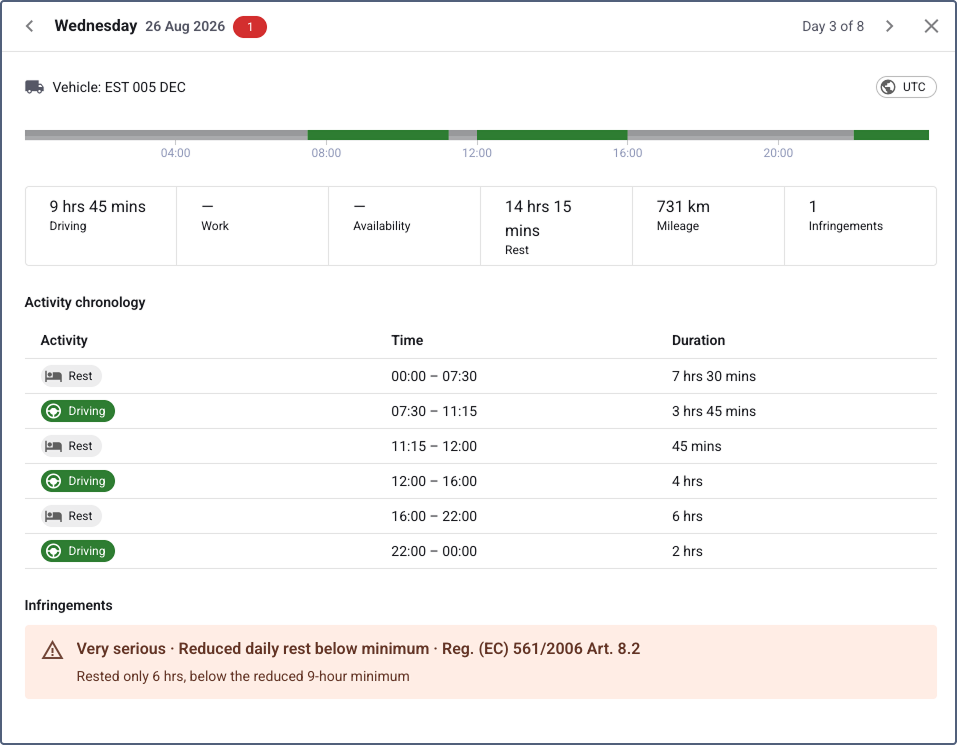
If no infringements were detected on the day, the section isn’t shown, and the counter in the header shows zero.
To review the infringements of several drivers at once, use the Tachograph infringements report.
Events
The chronography shows the following events recorded by the tachograph. Point events happen at a single moment and show one time. Other events last for some time and show a time range.
| Event | Shown as | Description |
|---|---|---|
| Card inserted | Point | The driver card was inserted into a tachograph slot. The description shows the country entered by the driver. |
| Card withdrawn | Point | The driver card was removed from a tachograph slot. The description shows the country entered by the driver. |
| Manual entry | Period | The driver added activities manually, for example, for a period when the card wasn’t inserted. |
| Border crossing | Point | The vehicle crossed a country border. The description shows both countries, for example, Poland → Estonia. |
| Ferry or train crossing | Period | The vehicle was transported by ferry or train. |
| Cargo loaded | Point | A cargo loading operation was recorded. |
| Cargo unloaded | Point | A cargo unloading operation was recorded. |
| Vehicle changed | Point | The driver started working on another vehicle. The description shows both registration numbers, for example, PL AB 1234 → EE EF 5678. |
| Out of scope driving | Period | The driver marked driving as out of the scope of EU Regulation 561/2006. |
To review the same events for several drivers at once, use the Driver activity events report.
Gaps in data
A gap in data is a period within a day that isn’t covered by any activity record from the tachograph card. Gaps help you tell the difference between the time when the driver really wasn’t working and the time for which no record exists.
In the day details, a gap appears as an empty section on the activity bar and as a No data row in the Activity chronology table, with its own time range and duration.
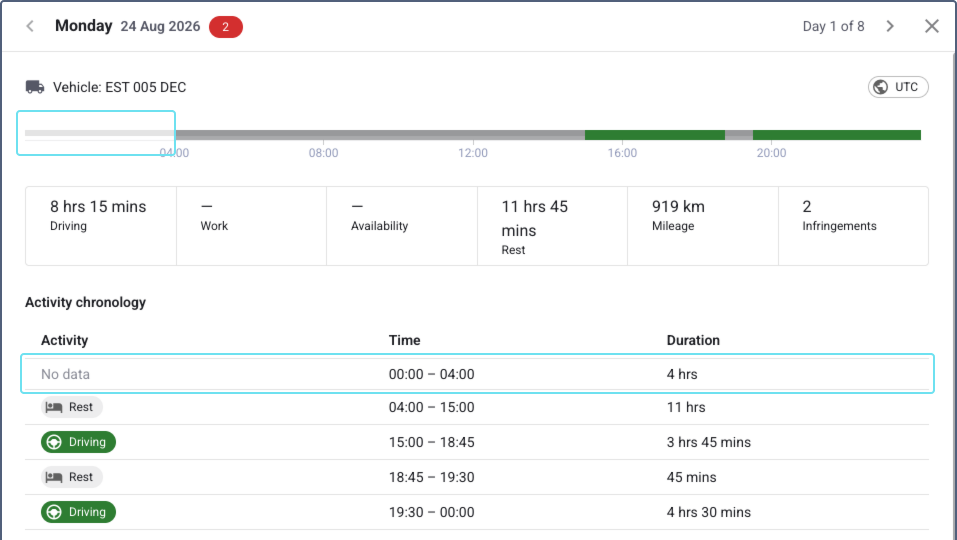
Gaps appear when the driver card wasn’t inserted into a tachograph during this period, or when the files covering it haven’t been downloaded from the card. If a day has no records at all, its chronology stays empty.
To review gaps for several drivers at once, use the Driver activity events report and select the Gaps in data event type. Unlike the activity bar, the report shows the exact start and end time of each gap.
To keep the chronography complete, download the driver card files within the intervals required by the regulations. For details, see Monitoring due dates for tachograph file downloads.