Generating the “Tachograph infringements” report
Who can do it: Service provider, Customer
Where: Wialon Platform FleetSpace
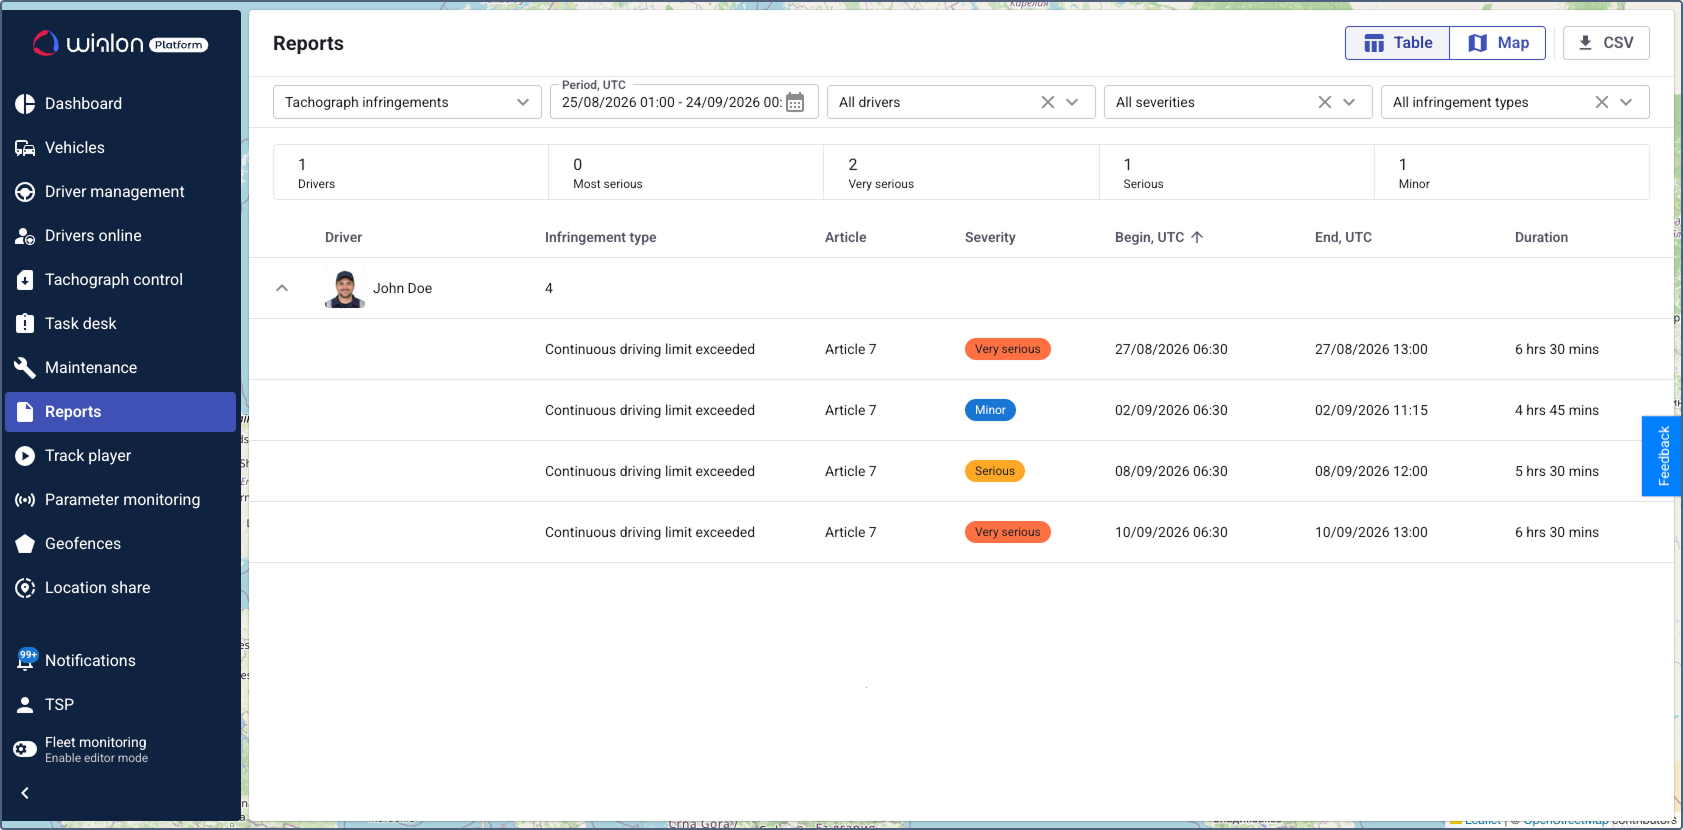
The Tachograph infringements report shows the driving and rest time violations detected in the downloaded tachograph files, based on EU Regulation 561/2006. Use it to check which drivers exceeded the legal limits, how serious each violation was, and how long it lasted.
Generating the report
To generate the report, follow these steps:
- In Wialon Platform FleetSpace, go to the Reports page.
- In the report type list, select Tachograph infringements.
- Click the Period, UTC field, specify the report period, and click Apply.
- In the drivers list, select one or more drivers.
- In the severities list, select the severity levels you want to include, or leave All severities selected.
- In the infringement types list, select the types you want to include, or leave All infringement types selected.
The report is generated automatically after you select the drivers, severities, and infringement types. To reset a filter, click the icon  next to it.
The report period and all infringement times are shown in UTC, not in your account time zone. This matches the way tachographs record data, so the values can be compared with the original tachograph files.
Report results
The report is organized into two parts: a summary at the top and a detailed table below.
Summary
At the top of the report, a summary section shows the number of drivers with at least one infringement in the selected period, and the number of infringements of each severity level:
| Card | Description |
|---|---|
| Drivers | The number of drivers that have at least one infringement matching the selected filters. |
| Most serious | The number of the most serious infringements. |
| Very serious | The number of very serious infringements. |
| Serious | The number of serious infringements. |
| Minor | The number of minor infringements. |
Report table
The results are grouped by driver. The collapsed row shows the driver name and the total number of their infringements. Click the icon  to expand the row and see the individual infringements.
| Column | Description |
|---|---|
| Driver | The name of the driver. In the collapsed row, the Infringement type column shows the number of infringements found for this driver. |
| Infringement type | The rule that was broken, for example, Weekly driving limit exceeded. |
| Article | The article of EU Regulation 561/2006 that defines the rule, for example, Article 6(2). |
| Severity | The severity of the infringement, shown as a color-coded chip. See Severity levels. |
| Begin, UTC | The date and time when the infringement started. |
| End, UTC | The date and time when the infringement ended. |
| Duration | How long the infringement lasted. |
To sort the table, click a column header. Click the header again to switch between ascending and descending order. By default, the infringements are sorted by the Begin, UTC column.
Severity levels
The severity of each infringement is defined by EU Regulation 561/2006 and depends on how far the driver went beyond the limit:
| Severity | Chip color |
|---|---|
| Most serious | Red |
| Very serious | Orange |
| Serious | Yellow |
| Minor | Blue |
For example, if a driver starts the weekly rest too late, the infringement is Minor when the rest starts less than 3 hours late, Serious when it starts 3 to 12 hours late, and Very serious when it starts 12 hours late or more.
Exporting the report
To download the report in CSV format, click CSV at the top of the page.